Review
. 2006;7 Suppl 1(Suppl 1):S2.1-31.
doi: 10.1186/gb-2006-7-s1-s2. Epub 2006 Aug 7.

EGASP: the human ENCODE Genome Annotation Assessment Project

Affiliations
Review

EGASP: the human ENCODE Genome Annotation Assessment Project

Roderic Guigó et al. Genome Biol. 2006.

Abstract

Background: We present the results of EGASP, a community experiment to assess the state-of-the-art in genome annotation within the ENCODE regions, which span 1% of the human genome sequence. The experiment had two major goals: the assessment of the accuracy of computational methods to predict protein coding genes; and the overall assessment of the completeness of the current human genome annotations as represented in the ENCODE regions. For the computational prediction assessment, eighteen groups contributed gene predictions. We evaluated these submissions against each other based on a 'reference set' of annotations generated as part of the GENCODE project. These annotations were not available to the prediction groups prior to the submission deadline, so that their predictions were blind and an external advisory committee could perform a fair assessment.

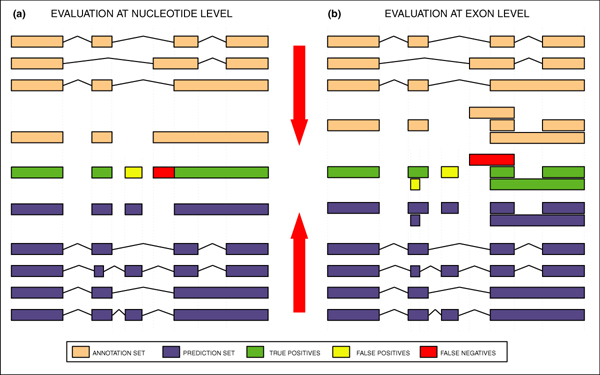
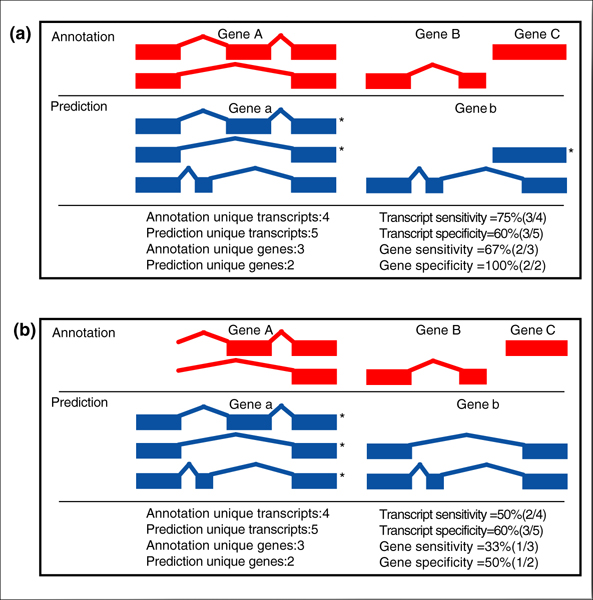
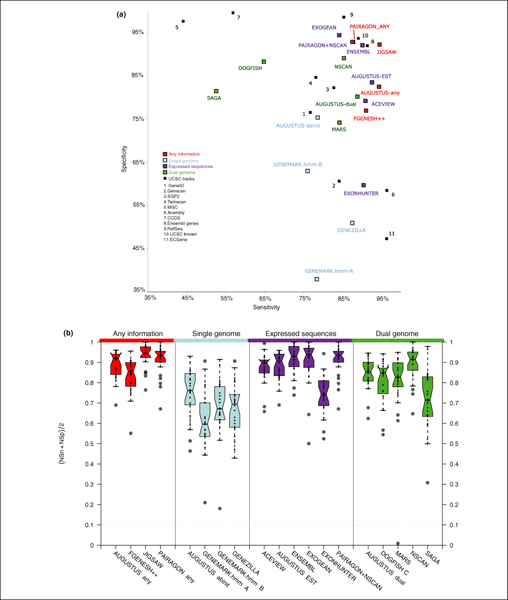
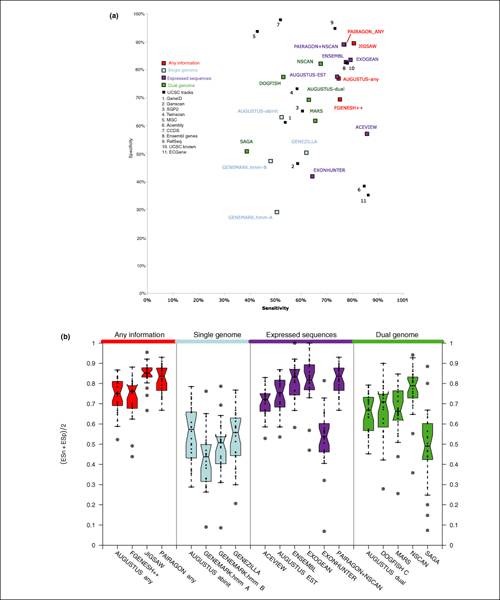
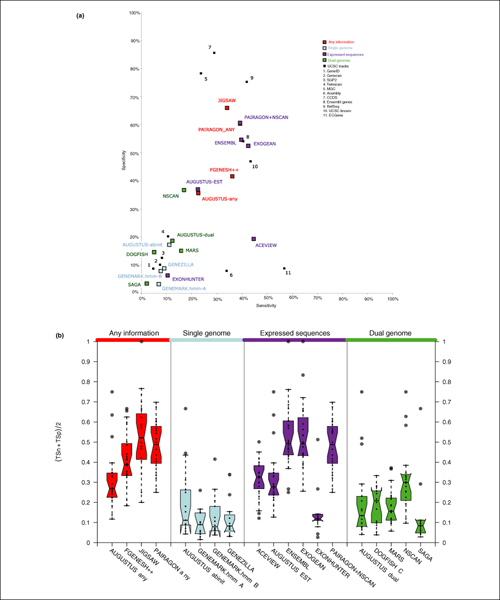
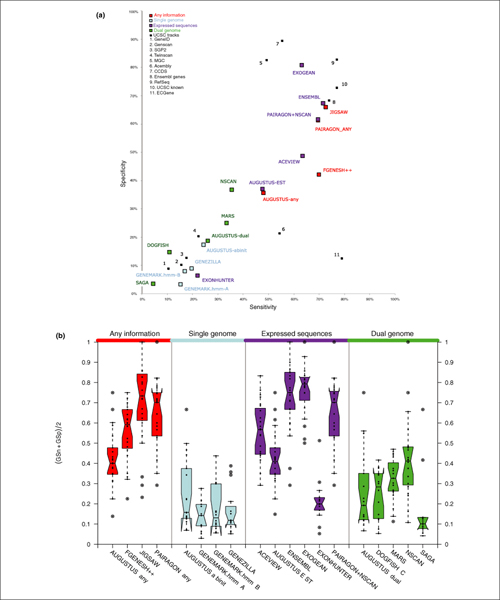
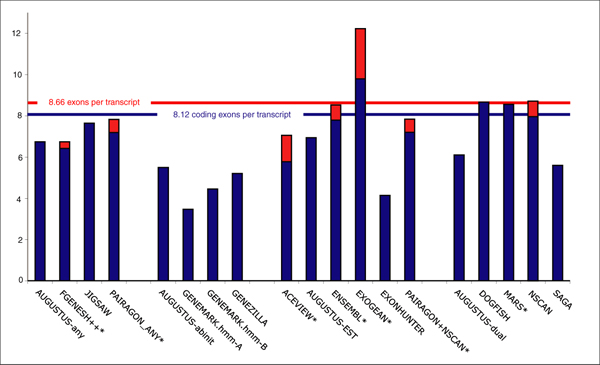
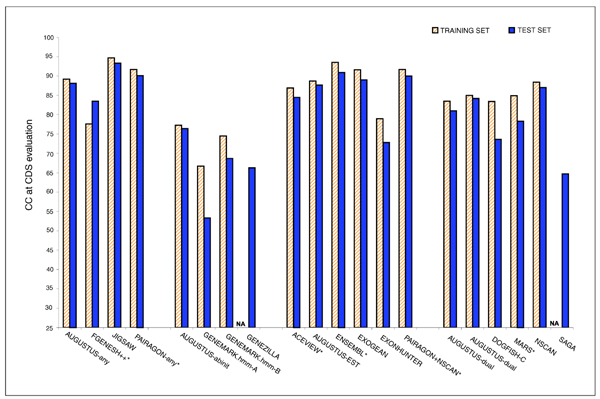
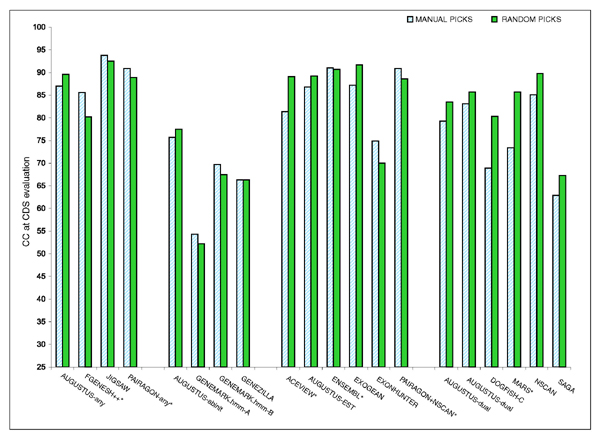
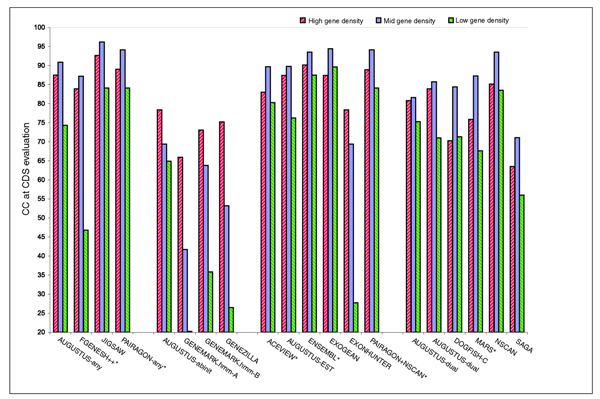
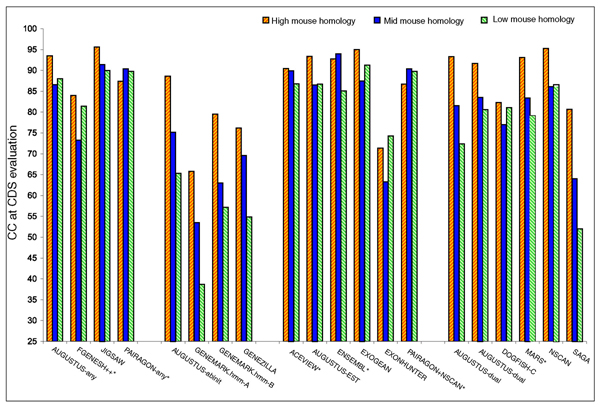
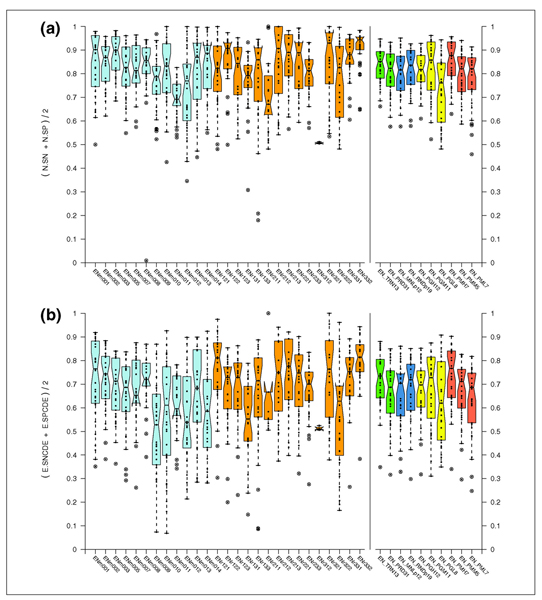
Results: The best methods had at least one gene transcript correctly predicted for close to 70% of the annotated genes. Nevertheless, the multiple transcript accuracy, taking into account alternative splicing, reached only approximately 40% to 50% accuracy. At the coding nucleotide level, the best programs reached an accuracy of 90% in both sensitivity and specificity. Programs relying on mRNA and protein sequences were the most accurate in reproducing the manually curated annotations. Experimental validation shows that only a very small percentage (3.2%) of the selected 221 computationally predicted exons outside of the existing annotation could be verified.

Conclusion: This is the first such experiment in human DNA, and we have followed the standards established in a similar experiment, GASP1, in Drosophila melanogaster. We believe the results presented here contribute to the value of ongoing large-scale annotation projects and should guide further experimental methods when being scaled up to the entire human genome sequence.


Figures

Figure 1
Figure 1
A screenshot of the EGASP submission server [47]. The server was user-authenticated in order to keep the submitted predictions in private before the EGASP workshop. Initially, there were eight suggested submission categories. However, after the workshop, category 5 was not used at all and removed. Promoter and pseudogene predictions from category 8 were then kept as a new category 7, which is not analyzed in this paper (see [45] instead).
Figure 2
Figure 2
The GencodeDB Genome Browser. A screenshot of the GencodeDB Genome Browser [49], displaying the annotation features on 100 Kbp from the ENm001 region (chr7: 116,074,892-116,174,891). The annotations along with the predicted genes by each submitted method were made publicly available together with further experimental evidence, such as TARs/transfrags.
Figure 3
Figure 3
Gene Feature Projection for evaluation. The process of projecting genic features into unique nucleotide and exon coordinates in order to compute the accuracy values (see text for details).
Figure 4
Figure 4
Gene transcript evaluation. Computing sensitivity and specificity at transcript level: (a) complete transcript annotation; (b) incomplete transcript annotation. Transcripts marked with an asterisk are considered 'consistent with the annotation' and will be scored as correct.
Figure 5
Figure 5
Gene Prediction Accuracy at the nucleotide level: Sensitivity versus specificity. Top panel: dotplot for sensitivity versus specificity at the nucleotide level for CDS evaluation. Each dot represents the overall value for each program on the 31 test sequences. Bottom panel: boxplots of the average sensitivity and specificity ((Sn + Sp)/2) for each program. Each dot corresponds to the average in each of the test sequences for which a GENCODE annotation existed (27 out of 31 sequences).
Figure 6
Figure 6
Gene Prediction Accuracy at the exon level: Sensitivity versus specificity. Top panel: dotplot for sensitivity versus specificity at the exon level for CDS evaluation. Each dot represents the overall value for each program on the 31 test sequences. Bottom panel: boxplots of the average sensitivity and specificity for each program. Each dot corresponds to the average in each of the test sequences for which GENCODE annotation existed.
Figure 7
Figure 7
Gene Prediction Accuracy at the transcript level: Sensitivity versus specificity. Top panel: dotplot for sensitivity versus specificity at the transcript level for CDS evaluation. Each dot represents the overall value for each program on the 31 test sequences. Bottom panel: boxplots of the average sensitivity and specificity for each program. Each dot corresponds to the average in each of the test sequences for which GENCODE annotation existed.
Figure 8
Figure 8
Gene Prediction Accuracy at the gene level: Sensitivity versus specificity. Top panel: dotplot for sensitivity versus specificity at the gene level for CDS evaluation. Each dot represents the overall value for each program on the 31 test sequences. Bottom panel: boxplots of the average sensitivity and specificity for each program. Each dot corresponds to the average in each of the test sequences for which GENCODE annotation existed.
Figure 9
Figure 9
Exon counts per gene transcript. A comparison of the number of exons per transcript and coding exons per transcript in the GENCODE annotation of the 31 test regions and in the predictions. Blue bars show the average number of coding exons per coding transcript for each of the programs in categories 1, 2, 3, and 4; the blue line shows this for the GENCODE annotation. The number of all exons per transcript in the GENCODE annotation is shown with a red line. Those programs that predict non-coding exons are noted with red bars. Programs marked with an asterisk predict multiple transcripts per gene locus.
Figure 10
Figure 10
Correlation Coefficient Accuracy for Training and Test Sequences. The correlation coefficient (CC) at the nucleotide level for CDS evaluation for sequences EN_TRN13 and EN_PRD31 for training and test set sequences. NA, not available; because the submitters did not send their results for the training set.
Figure 11
Figure 11
Correlation Coefficient Accuracy for manually and randomly selected Sequences. The correlation coefficient (CC) at the nucleotide level for CDS evaluation for EN_MNLp12 and EN_RNDp19 for manually and randomly selected sequences within the test set.
Figure 12
Figure 12
Correlation Coefficient Accuracy in relation to gene density. The correlation coefficient (CC) at the nucleotide level for sequences EN_PGH12, EN_PGM11 and EN_PGL8 for high, mid and low gene density sequence sets within the test set.
Figure 13
Figure 13
Correlation Coefficient Accuracy in relation to sequence conservation. The correlation coefficient (CC) at the nucleotide level for sequences EN_PMH7, EN_PMM5 and EN_PML7 for high, mid and low conservation with mouse sequences only for the randomly selected sequences in the test set.
Figure 14
Figure 14
Gene Prediction Accuracy for each ENCODE sequence at the nucleotide and exon levels. Boxplots showing the average sensitivity and specificity at the (a) nucleotide level and (b) exon level for CDS evaluation of each program on every sequence of the test set. Sequences are displayed across the x-axes. Manual picks are shown in in light blue; random picks are shown in orange. Boxplots corresponding to the overall average sensitivity and specificity at the nucleotide level for CDS evaluation in different subsets of the ENCODE sequences are shown at the right of the graph. EN_TRN13, the set of 13 training regions, and EN_PRD31, the set of 31 test regions, are shown in green. EN_MNLp12, the 12 manual picks in the test set, and EN_RNDp19, the 19 random picks in the test set are shown in dark blue. EN_PGH12/EN_PGM11/EN_PGL8, the subsets of 12 high, 11 medium and 8 low gene dense sequences from the set of test sequences, are shown in yellow. EN_PMH7/EN_PMM5/EN_PML7, the subsets of seven regions with high sequence conservation with mouse, five regions with medium conservation, and seven regions with low conservation from random picks in the test set, are shown in red.

References

    1. Venter JC, Adams MD, Myers EW, Li PW, Mural RJ, Sutton GG, Smith HO, Yandell M, Evans CA, Holt RA, et al. The sequence of the human genome. Science. 2001;291:1304–1351. doi: 10.1126/science.1058040. - DOI - PubMed
    1. Lander ES, Linton LM, Birren B, Nusbaum C, Zody MC, Baldwin J, Devon K, Dewar K, Doyle M, FitzHugh W, et al. Initial sequencing and analysis of the human genome. Nature. 2001;409:860–921. doi: 10.1038/35057062. - DOI - PubMed
    1. International Human Genome Sequencing Consortium Finishing the euchromatic sequence of the human genome. Nature. 2004;431:931–945. doi: 10.1038/nature03001. - DOI - PubMed
    1. Pruitt KD, Tatusova T, Maglott DR. NCBI Reference Sequence (RefSeq): a curated non-redundant sequence database of genomes, transcripts and proteins. Nucleic Acids Res. 2005;(33 Database):D501–504. - PMC - PubMed
    1. Gerhard DS, Wagner L, Feingold EA, Shenmen CM, Grouse LH, Schuler G, Klein SL, Old S, Rasooly R, Good P, et al. The status, quality, and expansion of the NIH full-length cDNA project: the Mammalian Gene Collection (MGC). Genome Res. 2004;14:2121–2127. doi: 10.1101/gr.2596504. - DOI - PMC - PubMed

Publication types