. 2006 Sep;74(9):5200-10.
doi: 10.1128/IAI.00534-06.

Dissecting the contributions of Clostridium perfringens type C toxins to lethality in the mouse intravenous injection model

Affiliations

Dissecting the contributions of Clostridium perfringens type C toxins to lethality in the mouse intravenous injection model

Derek J Fisher et al. Infect Immun. 2006 Sep.

Abstract

The gram-positive anaerobe Clostridium perfringens produces a large arsenal of toxins that are responsible for histotoxic and enteric infections, including enterotoxemias, in humans and domestic animals. C. perfringens type C isolates, which cause rapidly fatal diseases in domestic animals and enteritis necroticans in humans, contain the genes for alpha toxin (plc), perfringolysin O (pfoA), beta toxin (cpb), and sometimes beta2 toxin (cpb2) and/or enterotoxin (cpe). Due to the economic impact of type C-induced diseases, domestic animals are commonly vaccinated with crude type C toxoid (prepared from inactivated culture supernatants) or bacterin/toxoid vaccines, and it is not clear which toxin(s) present in these vaccines actually elicits the protective immune response. To improve type C vaccines, it would be helpful to assess the contribution of each toxin present in type C supernatants to lethality. To address this issue, we surveyed a large collection of type C isolates to determine their toxin-producing abilities. When late-log-phase vegetative culture supernatants were analyzed by quantitative Western blotting or activity assays, most type C isolates produced at least three lethal toxins, alpha toxin, beta toxin, and perfringolysin O, and several isolates also produced beta2 toxin. In the mouse intravenous injection model, beta toxin was identified as the main lethal factor present in type C late-log-phase culture supernatants. This conclusion was based on monoclonal antibody neutralization studies and regression analyses in which the levels of alpha toxin, beta toxin, perfringolysin O, and beta2 toxin production were compared with lethality. Collectively, our results highlight the importance of beta toxin for type C-induced toxemia.


Figures

FIG. 1.
FIG. 1.
Optimization of growth conditions for production of CPB by genotype C vegetative cultures. Four representative genotype C isolates were grown in TGY medium at 37°C. Every ∼1.5 h the OD600 was determined in order to assess growth (A), and samples were removed to determine the amount of CPB present (B). (B) For CPB detection, vegetative culture supernatant samples were processed for Western blotting using anti-CPB MAb. Purified CPB was loaded in the left lane of each blot as a positive control, and sample times are indicated below the blots.
FIG. 2.
FIG. 2.
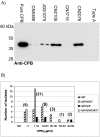
Western blot quantification of CPB in genotype C vegetative culture supernatants. Genotype C isolates were grown to the late log phase in TGY medium at 37°C and then processed for Western blot analysis of CPB. (A) Results for representative genotype C isolates (indicated at the top). The genotypes are as follows: CN5388, plc cpb cpe cpb2; CN2076, plc cpb cpe; JGS1075 and CN3715, plc cpb cpb2; and CN2109, plc cpb. The positions of molecular weight markers are indicated on the left (in kDa), and a cpb-negative type A isolate, as a negative control, was electrophoresed in the right lane. Pure CPB was electrophoresed in the left lane as a positive control. CPB levels in vegetative culture supernatants were determined by densitometric comparisons with a CPB standard curve generated using purified CPB. (B) CPB levels for isolates, expressed in μg/ml. Results are shown for each toxin subgenotype (all isolates are also plc+), and the total numbers of isolates for the different ranges are indicated in parentheses above the bars. ND, toxin could not be detected in culture supernatants.
FIG. 3.
FIG. 3.
Western blot analysis of CPB2 levels in cpb2-positive genotype C vegetative culture supernatants. Genotype C isolates carrying the cpb2 gene were grown in TGY medium at 37°C to the late log phase. Culture supernatant samples from these cultures were then processed with or without concentration (10- to 50-fold) and used for Western blot analysis of CPB2. (A) Representative Western blot for CPB2. The positions of molecular weight markers are indicated on the left, and pure CPB2 was electrophoresed in the left lane as a positive control. All isolates shown have toxin genotype plc cpb cpb2. The amount of CPB2 in each sample was determined by comparing the CPB2 signal density to a CPB2 standard curve generated using purified CPB2. (B) Amount of CPB2 in each sample. ND, toxin could not be detected in culture supernatants.
FIG. 4.
FIG. 4.
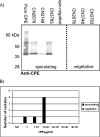
Detection and quantification of CPE in cpe-positive genotype C culture supernatants using Western blotting. Isolates were grown in either MDS or DS medium (for sporulating conditions) or TGY medium (for vegetative conditions) for 15 h at 37°C. Culture supernatants were sonicated, and lysates were subjected to Western blot analysis of CPE. (A) Purified CPE was electrophoresed in the left lane as a positive control, and a cpe-negative type A isolate was electrophoresed as a negative control. The positions of molecular weight markers are indicated on the left. Whether samples were obtained from sporulating or vegetative culture supernatants is indicated at the bottom. The amount of CPE in each isolate supernatant was determined by comparing the CPE signal intensity to a standard curve created using pure CPE. (B) CPE levels. ND, toxin could not be detected in culture supernatants.
FIG. 5.
FIG. 5.
PFO titers of genotype C isolates and selected genotype A isolates. Serial twofold dilutions of late-log-phase vegetative culture supernatants were incubated with horse erythrocytes to measure hemolysis. The last dilution that produced complete hemolysis (defined as a significant change in A570) was defined as the log2 titer. (A) PFO titers for genotype C isolates for each toxin subgenotype (all isolates are also plc+). The total numbers of isolates in the titer groups are indicated in parentheses. (B) PFO titers for representative type A isolates. ND, toxin could not be detected in culture supernatants.
FIG. 6.
FIG. 6.
PLC levels in genotype C and selected genotype A vegetative culture supernatants. Late-log-phase vegetative culture supernatants were assessed to determine their PLC activities using an egg yolk hydrolysis assay. A standard curve was generated using semipurified PLC. PLC activity is shown for genotype C isolates (A) and selected type A isolates (B). PLC results for genotype C isolates are shown for the different toxin subgenotypes (all isolates carry the plc gene). The total numbers of isolates in the PLC activity ranges are indicated in parentheses. ND, toxin could not be detected in culture supernatants.
FIG. 7.
FIG. 7.
Correlation of specific toxin levels of genotype C isolates and mouse lethality. Vegetative culture supernatants from select genotype C isolates were assessed to determine their levels of lethality using a mouse i.v. injection model. Pairs of mice were injected i.v. in the tail vein with dilutions of vegetative culture supernatants. The reciprocal of the last dilution that caused lethality in at least one of the two mice was defined as the LD50/ml (see Materials and Methods). The LD50/ml values were then correlated with the amounts of CPB, PLC, PFO, or CPB2 present in the vegetative culture supernatants. A linear equation was used to draw a best-fit line based on the data points, and the R2 for this line is indicated on each graph.

References

    1. Awad, M. M., D. M. Ellemor, R. L. Boyd, J. J. Emmins, and J. I. Rood. 2001. Synergistic effects of alpha-toxin and perfringolysin O in Clostridium perfringens-mediated gas gangrene. Infect. Immun. 69:7904-7910. - PMC - PubMed
    1. Ba-Thein, W., M. Lyristis, K. Ohtani, I. T. Nisbet, H. Hayashi, J. I. Rood, and T. Shimizu. 1996. The virR/virS locus regulates the transcription of genes encoding extracellular toxin production in Clostridium perfringens. J. Bacteriol. 178:2514-2520. - PMC - PubMed
    1. Bruce, R. D. 1985. An up-and-down procedure for acute toxicity testing. Fundam. Appl. Toxicol. 5:151-157. - PubMed
    1. Bueschel, D. M., B. H. Jost, S. J. Billington, H. T. Trinh, and J. G. Songer. 2003. Prevalence of cpb2, encoding beta2 toxin, in Clostridium perfringens field isolates: correlation of genotype with phenotype. Vet. Microbiol. 94:121-129. - PubMed
    1. Cheung, J. K., and J. I. Rood. 2000. The VirR response regulator from Clostridium perfringens binds independently to two imperfect direct repeats located upstream of the pfoA promoter. J. Bacteriol. 182:57-66. - PMC - PubMed

Publication types

Substances

Associated data

LinkOut - more resources