. 2006 Sep;74(9):5227-35.
doi: 10.1128/IAI.01220-05.

Mechanisms of mortality in early and late sepsis

Affiliations

Mechanisms of mortality in early and late sepsis

Hongyan Xiao et al. Infect Immun. 2006 Sep.

Abstract

A recent hypothesis postulates that sepsis moves through different phases, with periods of enhanced inflammation alternating with periods of immune suppression. In this study we determined the levels of inflammation present during early and late septic deaths to examine whether death was due to hyperinflammation or immunosuppression. The murine model of sepsis induced by cecal ligation and puncture (CLP) was used. Complete blood counts, plasma interleukin-6 (IL-6) levels, and body weights were determined. Mice that died within the first 4 days had increased plasma levels of IL-6, indicating that there was activation of the immune system. Cecal resection on day 4 after CLP resulted in decreased abscess size, lower circulating neutrophil counts, decreased anemia, and improved survival compared to the results for mice that received only antibiotic and fluid therapy. All of the mice that died in the chronic phase of infection (after day 4) had positive peritoneal cultures containing significantly more bacteria than the cultures for surviving mice. After day 4, none of the surviving mice exhibited increases in the plasma levels of IL-6. Dying mice exhibited mixed IL-6 responses; for 41% of the mice there was never an increase in the IL-6 levels in the chronic phase, while for other mice the levels of IL-6 transiently increased prior to death. Peritoneal macrophages were obtained in the late phase of sepsis from moribund and healthy mice and were stimulated ex vivo. The cells from the moribund mice produced significantly less IL-6 than the cells obtained from healthy mice produced. These results indicate that in mice that die in the early phase there is uniformly increased inflammation. However, during the chronic phase of sepsis, some mice die with evidence of immunosuppression (increased bacterial growth and low IL-6 levels), while other mice die with immunostimulation (high IL-6 levels and bacterial growth). Determining the inflammatory status of individual patients may help guide appropriate, targeted therapy.


Figures
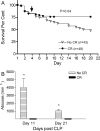
FIG. 1.
FIG. 1.
Effect of delayed cecal resection on mortality and abscess formation. CLP was performed, and then CR was done on 48 day 4 mice, while the remaining mice were only treated with antibiotics (n = 43). (A) In the first 4 days there was a 20% mortality rate. CR improved survival between days 4 and 20 compared to the survival with no resection (78% versus 45%; P = 0.04, as determined by log rank survival analysis). (B) Abdominal abscess size. Following CLP or CR the abscess was measured on days 11 and 21 after CLP. On day 11 abscesses were absent or had volumes that were <10 mm3 in mice with CR; the abscesses were significantly larger in the mice without CR. The same pattern was observed on day 21. The values are means ± standard errors of the means (n = 8 for day 11 and n = 14 to 26 for day 21). An asterisk indicates that the P value is <0.05 for a comparison of mice with CR to mice without CR.
FIG. 2.
FIG. 2.
Change in body weight. (A) Surviving mice. In the first 5 days after CLP the body weight (BW) declined precipitously. CR performed on day 4 (indicated by the arrow) resulted in transient greater weight loss compared to the weight loss for mice without CR. An asterisk indicates that the P value is <0.05 for a comparison of mice with CR to mice without CR. A two-way analysis of variance (from day 8 to day 18) indicated that the increase in body weight for the mice with CR was greater than the increase in body weight for the mice without CR (P < 0.0001). (B) Comparison of mice that died in the late phase and mice that died in the early phase. Mice without CR that died between days 8 and 21 (late deaths) were compared to mice that died early (days 1 to 4). The data used are the number of days prior to death rather than the number of days after CLP since mice died at different times. For mice that died in the chronic phase of sepsis the body weight decreased 1 to 3 days prior to death, and the mice lost 10 to 13% of their body mass per day. The values are means ± standard errors of the means. One asterisk indicates that the P value is <0.05 for a comparison of late death to early death, and two asterisks indicate that the P value is <0.01 for a comparison of day −1 to day −4 (late deaths) or a comparison of day −1 to day −3 (early deaths) as well as a comparison of late death to early death.
FIG. 3.
FIG. 3.
Peripheral blood counts after CLP. CLP was performed on day 1, and CR was performed on day 4. The values for day 0 represent normal levels. (A) White blood cell (WBC) count decreased within 24 h and then increased to supranormal levels at day 8. After day 8, the WBC counts for mice without CR remained elevated, while the counts for the mice that underwent resection of the necrotic cecum at day 4 recovered to normal levels by day 11. (B) Lymphocytes (LY). The lymphocyte count decreased dramatically, and this was followed by recovery to levels slightly above the normal level. Mice with CR had lower lymphocyte counts in the chronic phase. (C) Monocytes (MO). Peripheral monocyte counts did not decrease initially and steadily increased after CLP. The monocyte levels remained elevated in the mice that did not undergo CR. (D) Hemoglobin (HB). Hemoglobin levels decreased in the acute phase, and mice without CR had anemia. The values are means ± standard errors of the means. An asterisk indicates that the P value is <0.05 for a comparison of mice with CR to mice without CR.
FIG. 4.
FIG. 4.
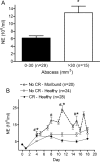
Peripheral blood neutrophil counts and abscess size. (A) Neutrophil (NE) levels correlated with abscess size. Surviving CLP mice were sacrificed on day 20; peripheral NE counts were determined immediately prior to sacrifice, and abscess sizes were determined after sacrifice. The neutrophil counts were greater in mice with larger abscesses. The values are means ± standard errors of the means for the numbers of mice indicated. An asterisk indicates that the P value is <0.05 for the difference between the groups. (B) CLP mice with and without CR were observed for 20 days. After an initial decrease, the neutrophil count increased; the highest levels were observed for the mice that died in the chronic phase of sepsis, and the lowest levels were observed for mice that had cecal resection. The values are means ± standard errors of the means. An asterisk indicates that the P value is <0.05 for a comparison of mice with CR that survived and mice without CR that survived. A number sign indicates that the P value is <0.05 for a comparison of mice without CR that died and mice without CR that survived.
FIG. 5.
FIG. 5.
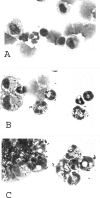
Peritoneal lavage cytology. Mice were examined daily and were determined to be dying or surviving as described in Materials and Methods. Cytospin slides were prepared from peritoneal lavage fluid. (A) Peritoneal lavage cells from a healthy mouse sacrificed on day 15 after CLP. No bacteria were observed. (B) Peritoneal lavage cells from a moribund mouse sacrificed on day 20. Several bacteria were identified in the cytoplasm of both macrophages and neutrophils. (C) Peritoneal lavage cells from a dying mouse sacrificed on day 11. The neutrophils and macrophages were filled with phagocytosed bacteria. Extracellular bacteria are also visible. All photomicrographs were taken at the same magnification.
FIG. 6.
FIG. 6.
Peritoneal bacterial CFU. Mice without cecal resection were determined to be surviving or dying. Mice were sacrificed between days 11 and 21, and the number of bacterial CFU in the peritoneal lavage fluid was determined. Each symbol represents an individual mouse. The resected group contained mice that had undergone cecal resection and were surviving. There were significantly more bacteria in the moribund mice than in the healthy mice (P < 0.001) and in the surviving mice than in the resected mice (P < 0.01).
FIG. 7.
FIG. 7.
Plasma IL-6 levels after CLP. Plasma levels of IL-6 were determined by using 20-μl samples collected from the tail vein after CLP (i.e., mice were not sacrificed to determine IL-6 levels). (A) IL-6 levels for early deaths and 21-day survivors. The mice that died in the acute phase of sepsis had elevated levels of IL-6 compared to the levels in survivors. (B) Plasma levels of IL-6 in seven mice that died after day 4. Although there was an initial increase in the IL-6 level at 6 h, in none of the mice was there an increase in the IL-6 level prior to death. (C) Plasma levels of IL-6 in five mice that increased prior to death. In 10 mice there were increases in the plasma levels of IL-6 immediately prior to death. The data for only five mice are shown to show the pattern of the increases. The increases in the IL-6 levels ranged from 2,000 to 12,700 pg/ml. An asterisk indicates that the P value is <0.05 for a comparison of surviving mice and mice that died in 4 days. A number sign indicates that the P value is <0.05 for a comparison of mice that died in 4 days and mice that died after 4 days.
FIG. 8.
FIG. 8.
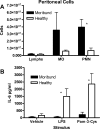
Harvested peritoneal cells and ex vivo stimulation. Mice identified as moribund or healthy were sacrificed, and the peritoneal cells were recovered. (A) Moribund mice had more macrophages and significantly more polymorphonuclear leukocytes (PMN) than healthy mice. (B) Ex vivo stimulation induced significantly higher levels of IL-6 in the healthy mice than in the moribund mice. An asterisk indicates that the P value is <0.05 for a comparison of moribund mice and healthy mice (n = 5 for moribund mice and n = 10 for healthy mice).

References

    1. Andersen, B. R., F. L. Kallehave, and H. K. Andersen. 2003. Antibiotics versus placebo for prevention of postoperative infection after appendicectomy. Cochrane Database Syst. Rev. 2:CD001439. [Online.] - PubMed
    1. Angus, D. C., W. T. Linde-Zwirble, J. Lidicker, G. Clermont, J. Carcillo, and M. R. Pinsky. 2001. Epidemiology of severe sepsis in the United States: analysis of incidence, outcome, and associated costs of care. Crit. Care Med. 29:1303-1310. - PubMed
    1. Annane, D., V. Sebille, C. Charpentier, P. E. Bollaert, B. Francois, J. M. Korach, G. Capellier, Y. Cohen, E. Azoulay, G. Troche, P. Chaumet-Riffaut, and E. Bellissant. 2002. Effect of treatment with low doses of hydrocortisone and fludrocortisone on mortality in patients with septic shock. JAMA 288:862-871. - PubMed
    1. Ayala, A., and I. H. Chaudry. 1996. Immune dysfunction in murine polymicrobial sepsis: mediators, macrophages, lymphocytes and apoptosis. Shock 6(Suppl. 1):S27-S38. - PubMed
    1. Baker, C. C., I. H. Chaudry, H. O. Gaines, and A. E. Baue. 1983. Evaluation of factors affecting mortality rate after sepsis in a murine cecal ligation and puncture model. Surgery 94:331-335. - PubMed

Publication types