

In vivo bioluminescence imaging of the murine pathogen Citrobacter rodentium
- PMID: 16926434
- PMCID: PMC1594854
- DOI: 10.1128/IAI.00848-06
In vivo bioluminescence imaging of the murine pathogen Citrobacter rodentium
Abstract
Citrobacter rodentium is a natural mouse pathogen related to enteropathogenic and enterohemorrhagic Escherichia coli. We have previously utilized bioluminescence imaging (BLI) to determine the in vivo colonization dynamics of C. rodentium. However, due to the oxygen requirement of the bioluminescence system and the colonic localization of C. rodentium, in vivo localization studies were performed using harvested organs. Here, we report the detection of bioluminescent C. rodentium and commensal E. coli during colonization of the gastrointestinal tract in intact living animals. Bioluminescence was dependent on intact blood circulation, suggesting that the colonic environment is not anaerobic but nanaerobic. In addition, BLI revealed that C. rodentium colonizes the rectum, a site previously unreported for this pathogen.
Figures
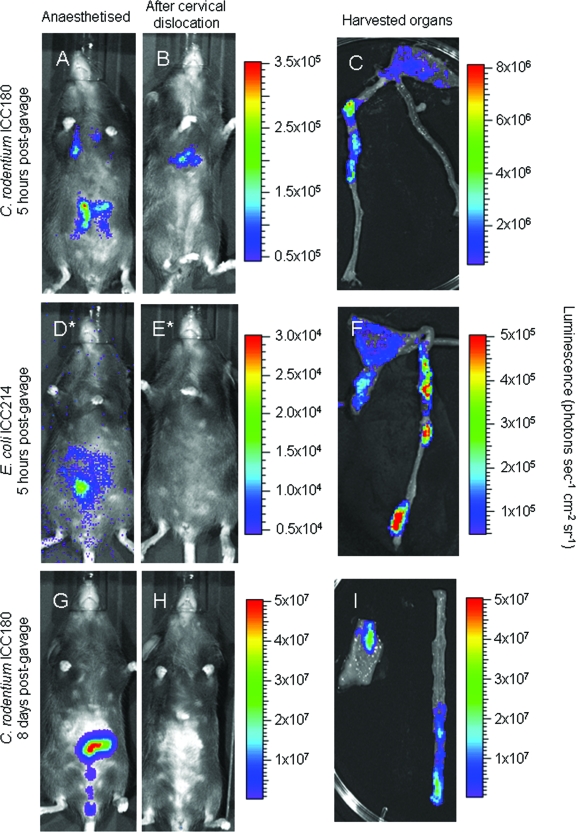
 , which required a 10-min integration). Images were acquired using an IVIS50 system and are displayed as pseudocolor images of peak bioluminescence, with variations in color representing light intensity at a given location. Red represents the most intense light emission, while blue corresponds to the weakest signal. The color bar indicates relative signal intensity (as photons s−1 cm−2 sr−1). For each time point, at least three animals were analyzed and a representative animal is shown.
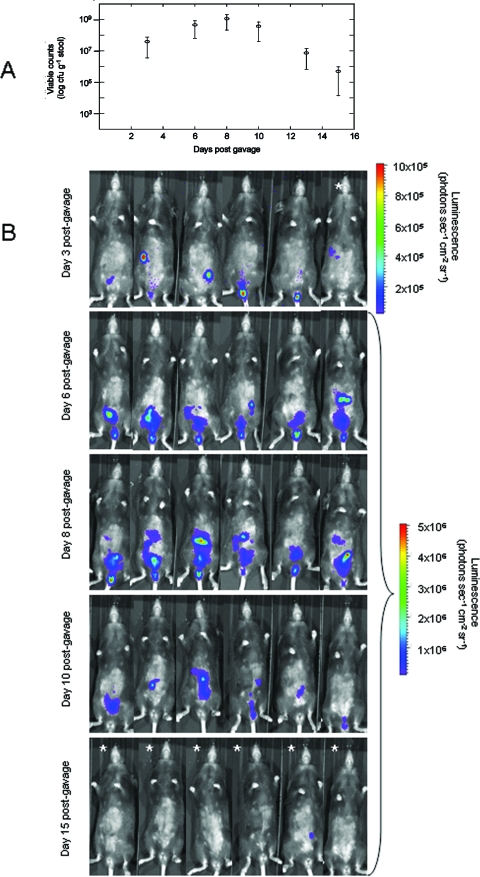 ).
).
References
-
- Baughn, A. D., and M. H. Malamy. 2004. The strict anaerobe Bacteroides fragilis grows in and benefits from nanomolar concentrations of oxygen. Nature 427:441-444. - PubMed
-
- Bourgois, J. J., F. E. Sluse, F. Baguet, and J. Mallefet. 2001. Kinetics of light emission and oxygen consumption by bioluminescent bacteria. J. Bioenerg. Biomembr. 33:353-363. - PubMed
-
- Contag, C. H., P. R. Contag, J. I. Mullins, S. D. Spilman, D. K. Stevenson, and D. A. Benaron. 1995. Photonic detection of bacterial pathogens in living hosts. Mol. Microbiol. 18:593-603. - PubMed
-
- Contag, C. H., and M. H. Bachmann. 2002. Advances in in vivo bioluminescence imaging of gene expression. Annu. Rev. Biomed. Eng. 4:235-260. - PubMed
Publication types
MeSH terms
Grants and funding
LinkOut - more resources
Full Text Sources
Other Literature Sources
