

Evaluation of a fiberoptic-based system for measurement of optical properties in highly attenuating turbid media
- PMID: 16928274
- PMCID: PMC1570472
- DOI: 10.1186/1475-925X-5-49
Evaluation of a fiberoptic-based system for measurement of optical properties in highly attenuating turbid media
Abstract
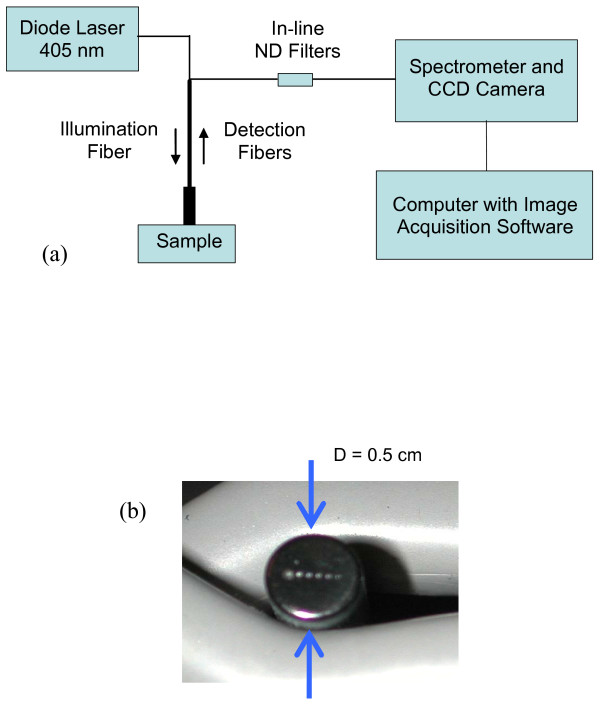
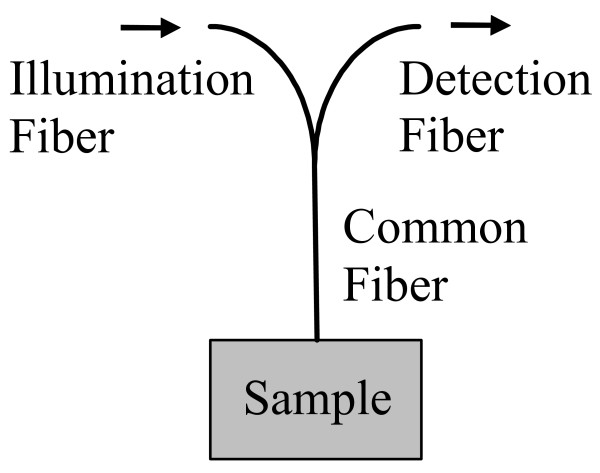
Background: Accurate measurements of the optical properties of biological tissue in the ultraviolet A and short visible wavelengths are needed to achieve a quantitative understanding of novel optical diagnostic devices. Currently, there is minimal information on optical property measurement approaches that are appropriate for in vivo measurements in highly absorbing and scattering tissues. We describe a novel fiberoptic-based reflectance system for measurement of optical properties in highly attenuating turbid media and provide an extensive in vitro evaluation of its accuracy. The influence of collecting reflectance at the illumination fiber on estimation accuracy is also investigated.
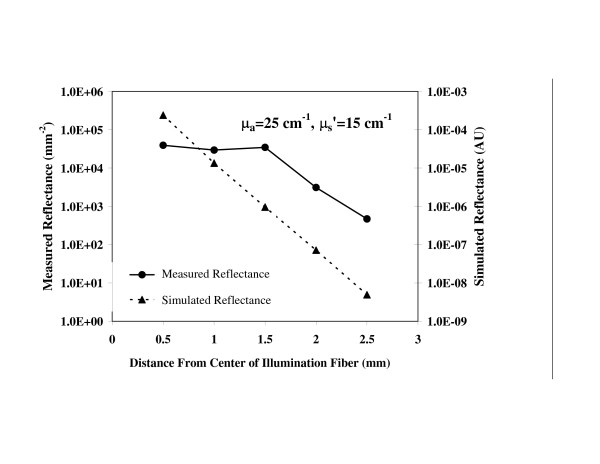
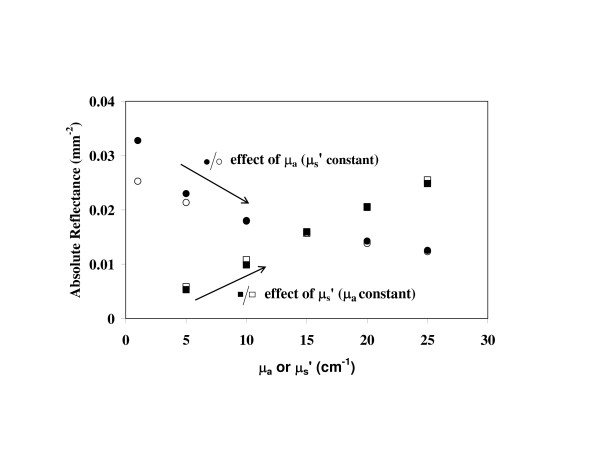
Methods: A neural network algorithm and reflectance distributions from Monte Carlo simulations were used to generate predictive models based on the two geometries. Absolute measurements of diffuse reflectance were enabled through calibration of the reflectance system. Spatially-resolved reflectance distributions were measured in tissue phantoms at 405 nm for absorption coefficients (mu(a)) from 1 to 25 cm-1 and reduced scattering coefficients (mu'(s)) from 5 to 25 cm-1. These data and predictive models were used to estimate the optical properties of tissue-simulating phantoms.
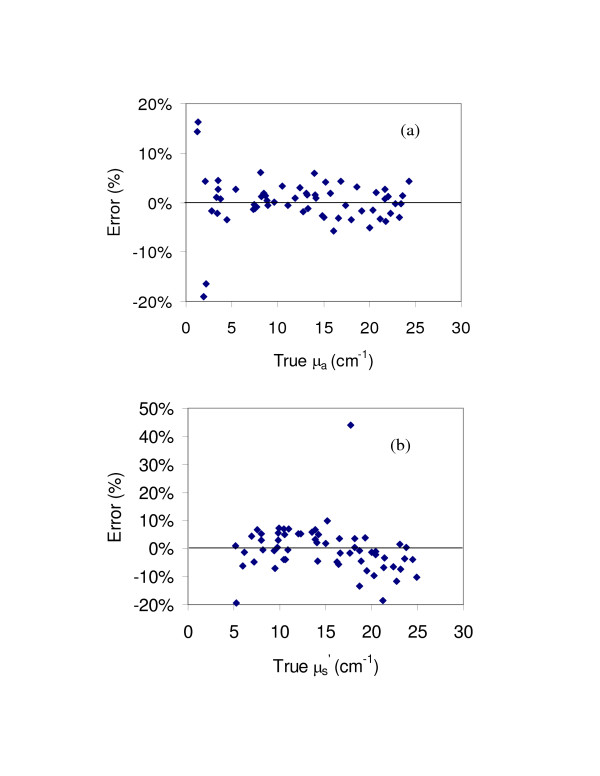
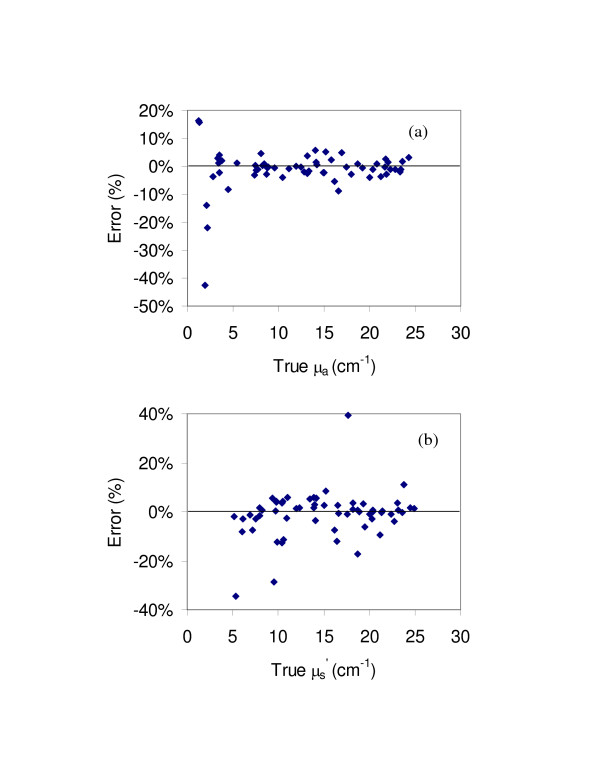
Results: By comparing predicted and known optical properties, the average errors for mu(a) and mu'(s) were found to be 3.0% and 4.6%, respectively, for a linear probe approach. When bifurcated probe data was included and samples with mu(a) values less than 5 cm-1 were excluded, predictive errors for mu(a) and mu'(s) were further reduced to 1.8% and 3.5%.
Conclusion: Improvements in system design have led to significant reductions in optical property estimation error. While the incorporation of a bifurcated illumination fiber shows promise for improving the accuracy of mu's estimates, further study of this approach is needed to elucidate the source of discrepancies between measurements and simulation results at low mu(a) values.
Figures

Similar articles
-
An integrated fiber-optic probe combined with support vector regression for fast estimation of optical properties of turbid media.Anal Chim Acta. 2015 Jun 23;880:122-9. doi: 10.1016/j.aca.2015.04.048. Epub 2015 Apr 28. Anal Chim Acta. 2015. PMID: 26092344
-
A fiberoptic reflectance probe with multiple source-collector separations to increase the dynamic range of derived tissue optical absorption and scattering coefficients.Opt Express. 2010 Mar 15;18(6):5580-94. doi: 10.1364/OE.18.005580. Opt Express. 2010. PMID: 20389574
-
A method for determination of the absorption and scattering properties interstitially in turbid media.Phys Med Biol. 2005 May 21;50(10):2291-311. doi: 10.1088/0031-9155/50/10/008. Epub 2005 May 5. Phys Med Biol. 2005. PMID: 15876668 Free PMC article.
-
Influence of the phase function in generalized diffuse reflectance models: review of current formalisms and novel observations.J Biomed Opt. 2014;19(7):75005. doi: 10.1117/1.JBO.19.7.075005. J Biomed Opt. 2014. PMID: 25027000 Free PMC article. Review.
-
Light dosimetry in vivo.Phys Med Biol. 1997 May;42(5):763-87. doi: 10.1088/0031-9155/42/5/003. Phys Med Biol. 1997. PMID: 9172258 Review.
Cited by
-
Spatial frequency domain spectroscopy of two layer media.J Biomed Opt. 2011 Oct;16(10):107005. doi: 10.1117/1.3640814. J Biomed Opt. 2011. PMID: 22029367 Free PMC article.
-
Characterization of the Optical Properties of Turbid Media by Supervised Learning of Scattering Patterns.Sci Rep. 2017 Nov 10;7(1):15259. doi: 10.1038/s41598-017-15601-4. Sci Rep. 2017. PMID: 29127385 Free PMC article.
-
In vivo spatial frequency domain spectroscopy of two layer media.J Biomed Opt. 2012 Oct;17(10):107006. doi: 10.1117/1.JBO.17.10.107006. J Biomed Opt. 2012. PMID: 23085984 Free PMC article.
-
Measurement of tissue scattering properties using multi-diameter single fiber reflectance spectroscopy: in silico sensitivity analysis.Biomed Opt Express. 2011 Nov 1;2(11):3150-66. doi: 10.1364/BOE.2.003150. Epub 2011 Oct 26. Biomed Opt Express. 2011. PMID: 22076275 Free PMC article.
-
Modelling spatially-resolved diffuse reflectance spectra of a multi-layered skin model by artificial neural networks trained with Monte Carlo simulations.Biomed Opt Express. 2018 Mar 7;9(4):1531-1544. doi: 10.1364/BOE.9.001531. eCollection 2018 Apr 1. Biomed Opt Express. 2018. PMID: 29675300 Free PMC article.
References
-
- Muller MG, Georgakoudi I, Zhang Q, Wu J, Feld MS. Intrisic fluorescence spectroscopy in turbid media: disentangling effects of scattering and absorption. Appl Opt. 2001;40:4633–4646. - PubMed
Publication types
MeSH terms
LinkOut - more resources
Full Text Sources
Other Literature Sources
Research Materials
