

Climate, energy and diversity
- PMID: 16928626
- PMCID: PMC1636092
- DOI: 10.1098/rspb.2006.3545
Climate, energy and diversity
Abstract
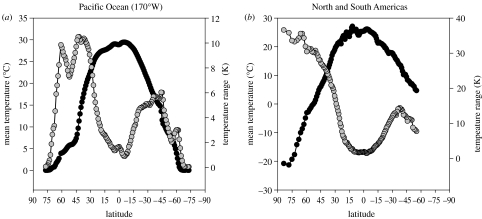
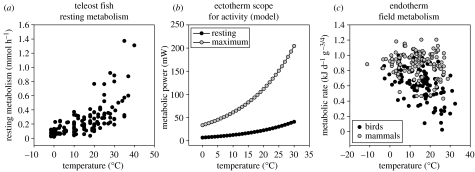
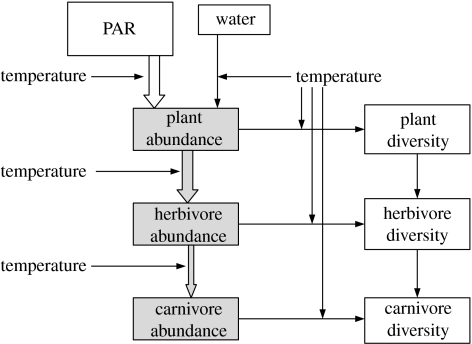
In recent years, a number of species-energy hypotheses have been developed to explain global patterns in plant and animal diversity. These hypotheses frequently fail to distinguish between fundamentally different forms of energy which influence diversity in dissimilar ways. Photosynthetically active radiation (PAR) can be utilized only by plants, though their abundance and growth rate is also greatly influenced by water. The Gibbs free energy (chemical energy) retained in the reduced organic compounds of tissue can be utilized by all heterotrophic organisms. Neither PAR nor chemical energy influences diversity directly. Both, however, influence biomass and/or abundance; diversity may then increase as a result of secondary population dynamic or evolutionary processes. Temperature is not a form of energy, though it is often used loosely by ecologists as a proxy for energy; it does, however, influence the rate of utilization of chemical energy by organisms. It may also influence diversity by allowing a greater range of energetic lifestyles at warmer temperatures (the metabolic niche hypothesis). We conclude that there is no single species/energy mechanism; fundamentally different processes link energy to abundance in plants and animals, and diversity is affected secondarily. If we are to make progress in elucidating these mechanisms, it is important to distinguish climatic effects on species' distribution and abundance from processes linking energy supply to plant and animal diversity.
Figures
References
-
- Allen A.P, Brown J.H, Gillooly J.F. Global biodiversity, biochemical kinetics, and the energy-equivalence rule. Science. 2002;297:1545–1548. doi:10.1126/science.1072380 - DOI - PubMed
-
- Allen, A. P., Gillooly, J. F. & Brown, J. H. In press. Recasting the species–energy hypothesis: the different roles of kinetic and potential energy in regulating biodiversity. In Scaling biodiversity (ed. D. Storch). Princeton, NJ: Princeton University Press.
-
- Anderson K.J, Jetz W. The broad-scale ecology of energy expenditure of endotherms. Ecol. Lett. 2005;8:310–318. doi:10.1111/j.1461-0248.2005.00723.x - DOI
-
- Bailey S.A, Horner-Devine M.C, Luck G, Moore L.A, Carney K.M, Anderson S, Betrus C.J, Fleishman E. Primary productivity and species richness: relationships among functional guilds, residency groups and vagility classes at multiple spatial scales. Ecography. 2004;27:207–217. doi:10.1111/j.0906-7590.2004.03631.x - DOI
-
- Barthlott W, Lauer W, Placke A. Global distribution of species diversity in vascular plants: towards a world map of phytodiversity. Erdkunde. 1996;50:317–327.
Publication types
MeSH terms
LinkOut - more resources
Full Text Sources