. 2006 Nov;80(21):10813-28.
doi: 10.1128/JVI.00851-06. Epub 2006 Aug 23.

Integrated molecular signature of disease: analysis of influenza virus-infected macaques through functional genomics and proteomics

Affiliations

Integrated molecular signature of disease: analysis of influenza virus-infected macaques through functional genomics and proteomics

T Baas et al. J Virol. 2006 Nov.

Abstract

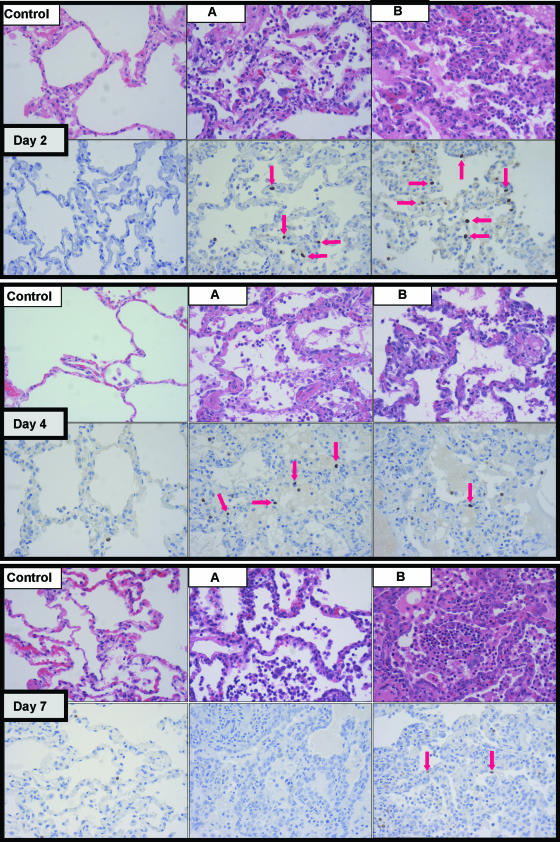
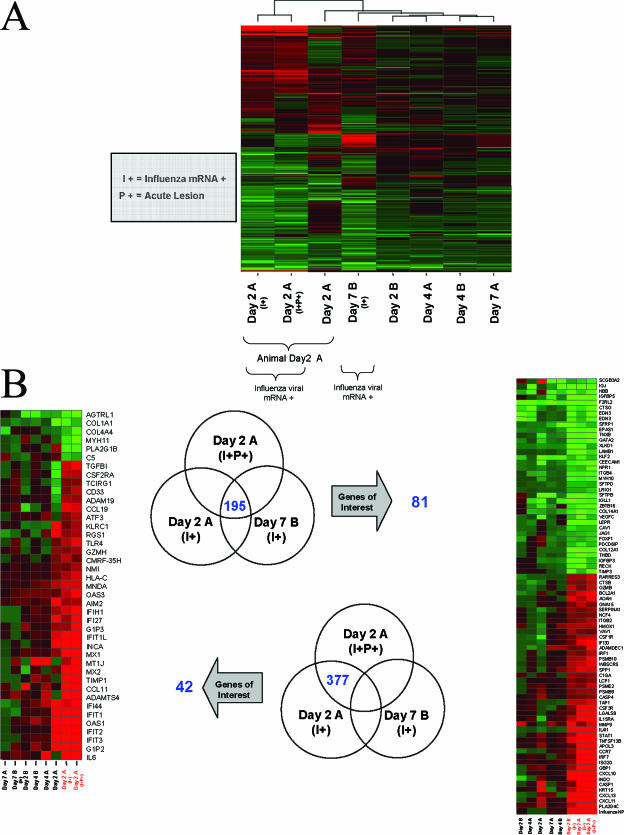
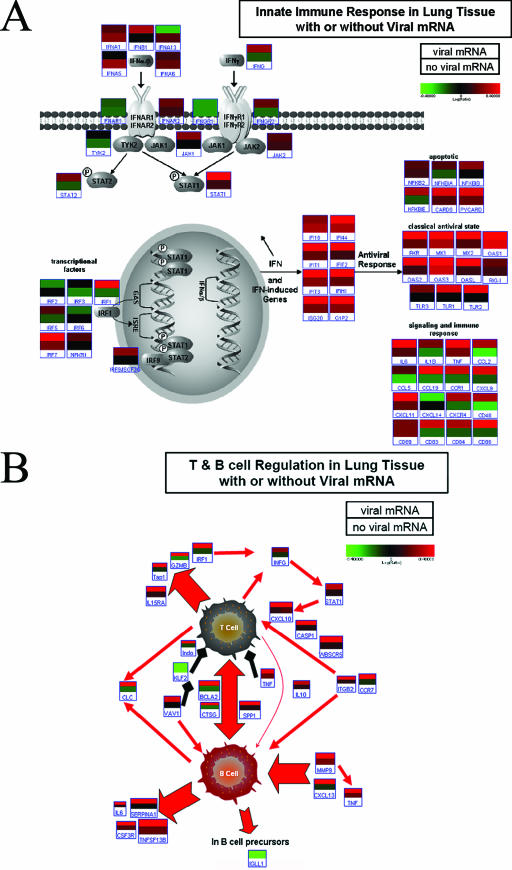
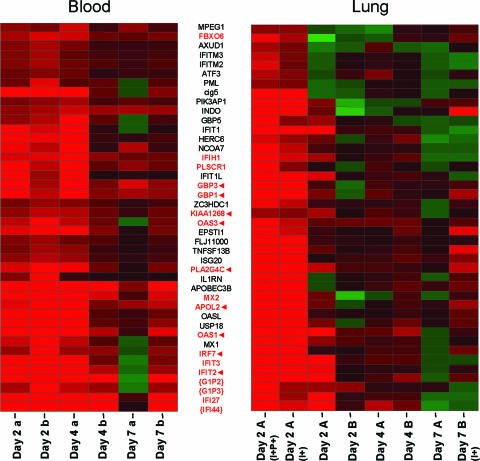
Recent outbreaks of avian influenza in humans have stressed the need for an improved nonhuman primate model of influenza pathogenesis. In order to further develop a macaque model, we expanded our previous in vivo genomics experiments with influenza virus-infected macaques by focusing on the innate immune response at day 2 postinoculation and on gene expression in affected lung tissue with viral genetic material present. Finally, we sought to identify signature genes for early infection in whole blood. For these purposes, we infected six pigtailed macaques (Macaca nemestrina) with reconstructed influenza A/Texas/36/91 virus and three control animals with a sham inoculate. We sacrificed one control and two experimental animals at days 2, 4, and 7 postinfection. Lung tissue was harvested for pathology, gene expression profiling, and proteomics. Blood was collected for genomics every other day from each animal until the experimental endpoint. Gross and microscopic pathology, immunohistochemistry, viral gene expression by arrays, and/or quantitative real-time reverse transcription-PCR confirmed successful yet mild infections in all experimental animals. Genomic experiments were performed using macaque-specific oligonucleotide arrays, and high-throughput proteomics revealed the host response to infection at the mRNA and protein levels. Our data showed dramatic differences in gene expression within regions in influenza virus-induced lesions based on the presence or absence of viral mRNA. We also identified genes tightly coregulated in peripheral white blood cells and in lung tissue at day 2 postinoculation. This latter finding opens the possibility of using gene expression arrays on whole blood to detect infection after exposure but prior to onset of symptoms or shedding.


Figures

FIG. 1.
FIG. 1.
For each day postinfection (day 2, day 4, and day 7), progressive microscopic histopathological changes (top panels) and influenza virus antigen staining (bottom panels) are shown. Red arrows point to discrete intranuclear staining in respiratory epithelium and denote the presence of viral NP antigen, indicative of recent active infection. Samples from a mock-infected animal are included for each day to show lack of pathology (top panels) and nonspecific cytoplasmic staining of neutrophils (bottom panels). All photographs were taken at 40× optical magnification.
FIG. 2.
FIG. 2.
(A) Unsupervised clustering of gene expression profiles. The profiles for animal Day 2 A show similarities based on the fact that they were sampled from the same animal, while viral-mRNA-positive samples showed similarities as well. Day 2 A (I+P+) was positive for viral mRNA and within the main lesion, Day 2 A (I+) was positive for viral mRNA and adjacent to the lesion, and Day 2 A was negative for viral mRNA and adjacent to the lesion as well. All gene expression profiles are the results of comparing gene expression in the lungs of individual experimental animals versus gene expression in the lungs of mock-infected animals (pooled), and genes were included if they met the criterion of a twofold or greater change (P ≤ 0.01). A two-of-eight strategy allowed samples to cluster together if profile similarities existed based on timing of inoculation (n = 2 samples for each day). A three-of-eight strategy allowed samples to cluster together if profile similarities existed based on the presence or absence of viral mRNA (n = 3 samples with viral mRNA) or based on the samples being from the same animal (n = 3 samples from animal Day 2 A). Very similar clusters were obtained in both cases, so only one is represented here. (B) Venn diagrams showing genes with changes of ≥2-fold (P ≤ 0.01) in samples Day 2 A (I+P+), Day 2 A (I+), and Day 7 B (I+) (upper Venn diagram) and in samples Day 2 A (I+P+) and Day 2 A (I+) but not in sample Day 7 B (I+) (lower Venn diagram). Although there were fewer genes within the intersection of the three samples (195 genes), a greater proportion of these genes was annotated and had functions relevant to the immune response, infectious disease, or pulmonary stress. Heat maps show the same genes regulated in day 2, 4, and 7 lung samples. All gene expression profiles are the results of comparing gene expression in the lungs of individual experimental animals versus gene expression in the lungs of mock-infected animals (pooled).
FIG. 3.
FIG. 3.
(A) Innate immune response in lung tissue with or without viral mRNA. The top bar of the individual gene heat maps was created by combining expression data for samples Day 2 A (I+P+), Day 2A (I+), and Day 7 B (I+), where viral mRNA was detected by array. The bottom bar was created by combining expression data for samples Day 2 A, Day 2 B, Day 4 A, Day 4 B, and Day 7 A, where no viral mRNA was detected. As in classical heat maps, brighter colors indicate stronger gene induction in combined samples, with red signifying upregulation and green downregulation. This illustrates the significant impact of the presence (top bar) or absence (bottom bar) of influenza viral mRNA on gene expression, even among essentially similarly affected portions of the same lung or among animals that were all infected. We selected probes with the strongest signals for any one gene for the purpose of these diagrams. All shown data are the results of comparing the combined gene expression in the lungs of experimental animals, as described above, versus gene expression in the lungs of mock-infected animals (pooled). This figure was produced using Resolver 4.0 (Rosetta Biosoftware) and Pathway Builder Tool (Protein Lounge, San Diego, CA). (B) T- and B-cell regulation in lung tissue with or without viral mRNA. All red arrows indicate activation and/or secretion. All black arrows indicate inhibitory interactions. The top bar of each heat map anchor was created by combining data from ratio experiments for Day 2 A (I+P+), Day 2 (I+), and Day 7 B (I+), in which viral mRNA was detected by array. The bottom bar of each heat map anchor was created by combining data from ratio experiments for Day 2 A, Day 2 B, Day 4 A, Day 4 B, and Day 7 A. This illustrates the significant impact of the presence or absence of influenza viral mRNA on gene expression, even among essentially similarly affected portions of the same lung or among animals that were all infected. We selected probes with the strongest signals for any one gene for the purpose of these diagrams. All heat map anchors are the results of comparing the combined gene expression in the lungs of individual experimental animals, as described above, versus gene expression in the lungs of mock-infected animals (pooled). This figure was produced using Resolver 4.0 (Rosetta Biosoftware) and Pathway Builder Tool (Protein Lounge, San Diego, CA).
FIG. 4.
FIG. 4.
Coregulated genes in blood and infected tissue. The heat map on the left indicates differential expression of blood samples taken from two animals (Day 7 A and Day 7 B) at day 2, day 4, and day 7. To indicate that these are blood samples, a and b are lowercase. The heat map on the right indicates differential expression of genes in pulmonary tissue collected from six animals. To indicate that these are pulmonary samples, A and B are uppercase. This figure shows strong and early coregulation of a set of genes in peripheral white blood cells and in lung tissue where influenza viral mRNA was detected by arrays, even in different animals. This set was obtained by unsupervised clustering of genes in blood and in lung tissue positive for viral mRNA and selecting genes that were regulated by a factor of twofold or more (P ≤ 0.01) in all four experiments. Some of these genes were still similarly regulated at day 4 and day 7 in blood, as shown in the left heat map (red font). Several of these genes shown to be regulated in blood were also regulated at multiple time points in the lungs (red arrows) as shown in the right heat map. Braces indicate genes whose profiles for blood must be interpreted with caution because the expression levels at day 0 in these individual blood samples differed by a factor of fourfold or more from those in all samples combined at day 0. All gene expression profiles for lung tissue are the results of comparing gene expression samples from individual experimental animals versus gene expression samples from mock-infected animals (pooled). All gene expression profiles for blood are the results of comparing gene expression samples from individual experimental animals at the indicated time points versus day 0 samples from the same animal.
FIG. 5.
FIG. 5.
Bar graph showing the total number of peptide identifications for proteins having previously known associations with influenza (Flu) virus infection or acute respiratory distress. Those proteins exhibiting an apparent regulation during influenza virus infection are indicated with asterisks. Apparent regulation indicates that the protein was identified with at least five peptides and also showed at least a threefold increase/decrease between samples from influenza-infected and mock-infected animals.
FIG. 6.
FIG. 6.
Diagram showing the overlap between proteins detected by mass spectrometry in pulmonary samples and mRNA detected by gene expression in pulmonary and peripheral blood samples. Red indicates induction, and green repression. We have chosen to highlight genes/proteins that showed concordance in the top panel. In addition, we show three proteins that were not previously identified using genomics alone. Gene expression: “++” indicates genes meeting the criteria of a >2-fold change and a P value of <0.01; “+” indicates genes that showed a consistent trend as far as induction or repression but did not make the array statistical cutoff. Gene expression results for determined trends were either combined in silico (Lung) or averaged from the time course data (Blood). Proteomics: “++” indicates that the protein was identified with at least five peptides and also showed a >3-fold change between samples from influenza-infected and mock-infected animals. “+” indicates that the protein was identified.

Similar articles

Cited by

References

    1. Aggarwal, S., S. Gollapudi, and S. Gupta. 1999. Increased TNF-alpha-induced apoptosis in lymphocytes from aged humans: changes in TNF-alpha receptor expression and activation of caspases. J. Immunol. 162:2154-2161. - PubMed
    1. Barnes, B., B. Lubyova, and P. M. Pitha. 2002. On the role of IRF in host defense. J. Interferon Cytokine Res. 22:59-71. - PubMed
    1. Baskin, C. R., A. García-Sastre, T. M. Tumpey, H. Bielefeldt-Ohmann, V. S. Carter, E. Nistal-Villán, and M. G. Katze. 2004. Integration of clinical data, pathology, and cDNA microarrays in influenza virus-infected pigtailed macaques (Macaca nemestrina). J. Virol. 78:10420-10432. - PMC - PubMed
    1. Basler, C. F., A. H. Reid, J. K. Dybing, T. A. Janczewski, T. G. Fanning, H. Zheng, M. Salvatore, M. L. Perdue, D. E. Swayne, A. Garcia-Sastre, P. Palese, and J. K. Taubenberger. 2001. Sequence of the 1918 pandemic influenza virus nonstructural gene (NS) segment and characterization of recombinant viruses bearing the 1918 NS genes. Proc. Natl. Acad. Sci. USA 98:2746-2751. - PMC - PubMed
    1. Batista, F. D., and M. S. Neuberger. 2000. B cells extract and present immobilized antigen: implications for affinity discrimination. EMBO J. 19:513-520. - PMC - PubMed

Publication types

MeSH terms