. 2006 Nov;80(21):10436-56.
doi: 10.1128/JVI.01248-06. Epub 2006 Aug 23.

CD8 T cells control cytomegalovirus latency by epitope-specific sensing of transcriptional reactivation

Affiliations

CD8 T cells control cytomegalovirus latency by epitope-specific sensing of transcriptional reactivation

Christian O Simon et al. J Virol. 2006 Nov.

Abstract

During murine cytomegalovirus (mCMV) latency in the lungs, most of the viral genomes are transcriptionally silent at the major immediate-early locus, but rare and stochastic episodes of desilencing lead to the expression of IE1 transcripts. This low-frequency but perpetual expression is accompanied by an activation of lung-resident effector-memory CD8 T cells specific for the antigenic peptide 168-YPHFMPTNL-176, which is derived from the IE1 protein. These molecular and immunological findings were combined in the "silencing/desilencing and immune sensing hypothesis" of cytomegalovirus latency and reactivation. This hypothesis proposes that IE1 gene expression proceeds to cell surface presentation of the IE1 peptide by the major histocompatibility complex (MHC) class I molecule L(d) and that its recognition by CD8 T cells terminates virus reactivation. Here we provide experimental evidence in support of this hypothesis. We generated mutant virus mCMV-IE1-L176A, in which the antigenic IE1 peptide is functionally deleted by a point mutation of the C-terminal MHC class I anchor residue Leu into Ala. Two revertant viruses, mCMV-IE1-A176L and the wobble nucleotide-marked mCMV-IE1-A176L*, in which Leu is restored by back-mutation of Ala codon GCA into Leu codons CTA and CTT, respectively, were constructed. Pulmonary latency of the mutant virus was found to be associated with an increased prevalence of IE1 transcription and with events of IE3 transactivator splicing. In conclusion, IE1-specific CD8 T cells recognize and terminate virus reactivation in vivo at the first opportunity in the reactivated gene expression program. The perpetual gene expression and antigen presentation might represent the driving molecular force in CMV-associated immunosenescence.


Figures
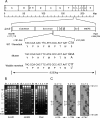
FIG. 1.
FIG. 1.
Construction and verification of recombinant viruses. (A) Maps of the mutagenesis, drawn to scale. The HindIII physical map of the mCMV Smith strain genome is shown at the top with the ie1/3 transcription unit expanded to reveal the location of the authentic antigenic IE1 peptide 168-YPHFMPTNL-176 coding region (WT/Revertant). By means of site-directed mutagenesis, the C-terminal MHC class I anchor residue Leu of the IE1 peptide was point mutated to Ala by mutating the Leu codon CTA into the Ala codon GCA (Mutant). Authentic revertant and wobble revertant (*) were generated by back-mutation of Ala codon GCA into Leu and Leu* codons CTA and CTT. The 6,523-bp BssHII/HpaI fragment comprises the ie1/3 transcription unit with the authentic or mutated IE1 peptide-coding region used in the shuttle plasmids for recombination. (B) Structural analysis of BAC plasmids. Purified DNA of BAC plasmids pSM3fr (lanes 1), C3XIE1Leu (lanes 2), C3XIE1Ala (lanes 3), and C3XIE1Leu* (lanes 4) was subjected to cleavage by EcoRI, HindIII, and XbaI, and fragments were analyzed by agarose gel electrophoresis and staining with ethidium bromide. Lanes M show the size markers. (C) Sequence analysis of mutated BAC plasmids. The fidelity of the sequences is shown between n181,011 and 181,028 for the BAC plasmids C3XIE1Ala (mutant L176A), C3XIE1Leu (revertant A176L), and C3XIE1Leu* (wobble revertant A176L*).
FIG. 2.
FIG. 2.
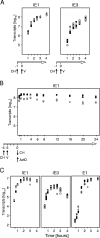
Influence of the Leu codon mutation on viral transcription. Throughout, MEFs were infected in six-well culture dishes at an MOI of 4 (0.2 PFU/cell × 20; centrifugal enhancement of infectivity) for transcriptional analysis. Closed and open symbols indicate infection with revertant virus mCMV-IE1-A176L and with mutant virus mCMV-IE1-L176A, respectively. Ordinate values represent copies per 50 ng of total RNA. Shown are the data from triplicate cultures. The schedules for inhibitor treatment (CH, 50 μg of cycloheximide per ml; ActD, 5 μg of actinomycin D per ml) and virus (V) infection are indicated. Time zero is defined as the end of the 30-min period of centrifugal infection. (A) MIE transcription in the absence of protein synthesis. MEFs were infected in the continuous presence of CH, and spliced IE1 (circles) and IE3 (squares) transcripts were quantified by real-timeRT-PCRs at the indicated time points after infection. (B) Stability of IE1 transcripts. Infection was performed for 3 h in the presence of CH. At the indicated time points after the replacement of CH by ActD, IE1 transcripts were quantified by real time RT-PCR. (C) Viral transcription in absence of metabolic inhibitors. At the indicated time points after infection, IE1 (circles), IE3 (squares), and E1 (diamonds) transcripts were quantified by real-time RT-PCRs.
FIG. 3.
FIG. 3.
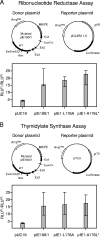
Influence of the L176A mutation on the IE1-dependent transactivation of cellular promoters. Transactivation of reporter genes by the authentic IE1 protein or the mutated IE1 protein was measured by a firefly-Renilla DLR assay. NIH 3T3 cells were cotransfected with reference plasmid pRL-TK encoding Renilla luciferase for standardization of transfection efficacy (not depicted), IE1 protein-encoding donor plasmid, and a reporter plasmid carrying a promoter of interest driving the expression of firefly luciferase. Donor plasmids were pIE100/1, specifying the authentic IE1 protein; pIE1-L176A, specifying the mutated IE1 protein; and pIE1-A176L*, specifying the rescued IE1 protein. Cotransfection with pUC19 in place of the donor plasmid served as a vector control.(A) Transactivation of the ribonucleotide reductase 2 promoter (PR2) by the IE1 protein. Plasmid pGL3R2 1.5 served as the reporter plasmid. (B) Transactivation of the thymidylate synthase promoter (PTS) by the IE1 protein. Plasmid pTLG served as the reporter plasmid. Plasmid maps (not drawn toscale) are illustrated. MIEPE, major immediate-early promoter and enhancer. Ex, exon. Arrows indicate the direction of transcription. Arrowheads mark the location of the mutation in exon 4. Lumines-cence data are expressed as RLU and are normalized for transfection efficacy by forming the quotient of firefly luciferase activity (RLUFL) and Renilla luciferase activity (RLURL). Gray-shaded bars represent the median values of triplicate assay cultures, and the error bars indicate the range.
FIG. 4.
FIG. 4.
Dispersion of nuclear domains ND10 by the mutated IE1 protein. MEFs were left uninfected (Ø) or were infected at an MOI of 4 (0.2 PFU/cell × 20; centrifugal enhancement of infection) with the BAC-derived mCMVs indicated. The analysis was performed at 4 h after infection corresponding to an early stage in the E phase. (A) Confocal laser scanning images. (a and e) Green staining for PML protein. Note that red Alexa Fluor 546 fluorescence was electronically converted into green for better contrast. (b and f) Blue counterstaining of DNA in the cell nucleus with DAPI. (c and g) Red staining for intranuclear mCMV proteins E1 and IE1, respectively. Note that green Alexa Fluor 488 fluorescence was electronically converted into red. (d and h) Merge of blue DAPI and green PML staining. Panels a to d and e to h each show an individual, representative cell after double labeling. Note the presence of green-stained intranuclear PML bodies in panels a and d in a cell infected with the ie1 gene deletion mutant and their absence in panels e and h in a cell infected with mutant mCMV-IE1-L176A. The bar marker represents 20 μm. (B) Quantification of intranuclear PML bodies. For statistical significance analysis, intranuclear PML bodies were counted for 30 infected cell nuclei per group. Dots represent the number of PML bodies in individual cell nuclei. The median values are marked by horizontal bars. P values are indicated for comparisons of major interest.
FIG. 5.
FIG. 5.
Virus replication and dissemination in vivo. Virus growth curves are shown as log-linear plots of infection load on the ordinate and time after infection on the abscissa. Infection loads in plantar tissue, spleen, and liver were determined at the indicated time points after subcutaneous, intraplantar infection of 7-Gy total-body γ-irradiated BALB/c recipients with 105 PFU (corresponds to ∼5 × 10⁷ viral genomes) of the BAC-derived mCMVs indicated. In plantar tissue and in the spleen, the viral loads per 106 tissue cells were quantified by real-time PCR specific for viral gene M55 (gB) normalized to the cellular gene pthrp. Infection of the liver was quantified by counting infected liver cells, which are mostly hepatocytes and some endothelial cells, in representative 10-mm2 areas of tissue sections. Infection of cells was identified by immunohistological staining of intranuclear IE1 protein. Dots represent data from three individual mice per time point, with median values marked. The DTs (95% confidence intervals of DTs are in parentheses) were calculated by log-linear regression analysis. Note that DNA load present on day 1 in plantar tissue (arrows) mostly represents DNA of the virus inoculum. Accordingly, data for day 1 in plantar tissue were excluded from the regression analysis of virus replication. The time point of first detection of infected liver cells is revealed by the intersection between the calculated regression line and ordinate 0 (corresponds to one infected cell per test area), which was between days 3 and 4 for all viruses tested. The horizontal bars indicate the corresponding 95% confidence intervals.
FIG. 6.
FIG. 6.
Immunological loss-of-function phenotype of the L176A mutation. Throughout, gray-shaded bars represent the frequencies of CD8 T cells that were successfully sensitized for IFN-γ secretion in ELISPOT assays. MPN values were determined by intercept-free linear regression analysis of data (spot counts) obtained for graded numbers of effector cells, each assayed in triplicate cultures. Error bars represent the corresponding 95% confidence intervals. (A) Reduction of MHC binding affinity of the IE1 peptide by the mutation. For their use as stimulator cells, P815 (H-2d haplotype) mastocytoma cells were exogenously loaded with synthetic peptides YPHFMPTNL and YPHFMPTNA at the concentrations indicated. Ø, no peptide added. Effector cells were CTLs (200 and 100 cells seeded) of a polyclonal IE1 epitope-specific CTL line (IE1-CTLL) representing a broad spectrum of TCR affinities. (B) Presentation of naturally processed IE1 peptides. Effector cells were CTLs (300, 200, 100, and 50 cells seeded) of the polyclonal IE1-CTLL. Stimulator cells were MEFs that were either left uninfected (n.i.) or were infected under conditions of selective and enhanced MIE gene expression (MOI, 4; cycloheximide replaced after 3 h by actinomycin D) with the viruses indicated. (C) Effect of the mutation on IE1 epitope-specific CD8 T-cell memory. Effector cells were CD8 T cells (104, 5 × 10³, and 103 cells seeded) isolated from the pooled spleens of three BALB/c mice at 5 months after intraplantar infection with 105 PFU of wobble revertant virus (top panel) or mutant virus (bottom panel). Target cells were P815 cells exogenously loaded with the indicated synthetic peptides at concentrations of 10−8 M, except for peptide YPHFMPTNA, which was used at 10−6 M. Ø, no peptide added.
FIG. 7.
FIG. 7.
Resolution of productive infection of the lungs and establishment of latency after bone marrow transplantation. (A) Time course of productive infection of the lungs. Infectious virus per lung was monitored by a PFU assay at the indicated time points after BMT and intraplantar infection with 105 PFU of revertant virus mCMV-IE1-A176L (closed circles) or mutant virus mCMV-IE1-L176A (open circles). Symbols represent data for individual BMT recipients with the median values indicated. P values compare mutant virus and revertant virus at each time point of analysis by the distribution-free Wilcoxon-Mann-Whitney rank sum test. p.i., postinfection. (B) Viral DNA load during pulmonary latency. Viral genomes were quantified at 1 year after BMT and infection in the two neighboring lung tissue pieces (10 and 11) of the postcaval lobe for five individual BMT recipients per group. Symbols (closed circles, revertant virus; open circles, mutant virus) represent triplicate real-time PCR data for each lung DNA preparation. Median values are indicated.
FIG. 8.
FIG. 8.
Frequency and virus epitope specificity of memory CD8 T cells present in latently infected lungs. Pulmonary CD8 T cells were isolated at 1 year after infection of BMT recipients from pools of six lungs and were tested as effector cells in IFN-γ-based ELISPOT assays. (A) BMT and infection with revertant virus mCMV-IE1-A176L. (B) BMT and infection with mutant virus mCMV-IE1-L176A. (Left panels) Stimulator cells were P815 mastocytoma cells exogenously loaded with the indicated synthetic peptides at concentrations of 10−8 M. Ø, no peptide added. Bars represent MPN values determined by intercept-free linear regression analysis of data (spot counts) obtained for graded numbers (8 × 10³, 4 × 10³, 1 × 10³) of effector cells, each assayed in triplicate cultures. Error bars represent the corresponding 95% confidence intervals. (Right panels) Stimulator cells were P815 mastocytoma cells pulsed with 60 μl of 800-μl HPLC fractions containing naturally processed peptides derived from MEFs at 24 h after infection with revertant virus (for testing group A) and mutant virus (for testing group B). Bars represent the median values of triplicate data obtained with a constant number of 4,000 effector cells for testing each HPLC fraction. Error bars indicate the range. Arrowheads mark the HPLC fractions in which the immunodominant peptides m164 and IE1 eluted. Miniature inserts document the identification of the HPLC fractions that contained peptides m164 and IE1. Cytolytic activities of lines m164-CTLL and IE1-CTLL were determined at an effector-to-target cell ratio of 15:1 with 1,000 P815 target cells pulsed with 10 μl of 800-μl HPLC fractions (highest concentration) or with 1:6, 1:36, or 1:216 dilutions thereof. Data represent the mean values of triplicate determinations.
FIG. 9.
FIG. 9.
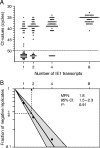
Detection limit of the IE1-specific real-time quantitative RT-PCR. (A) Graded numbers of synthetic polyadenylated IE1 transcripts in 48 replicates were amplified by real-time RT-PCR. Dots represent the numbers of cDNA amplification cycles (cycle threshold [Ct] values) required for detection, with the median values marked by horizontal bars. The dotted line indicates the cutoff value defined by the water control. (B) Limiting dilution (Poisson distribution) analysis based on the experimentally determined fraction of negative replicates (see panel A). The log-linear plot shows the Poisson distribution graph (calculated with the maximum-likelihood method) with its 95% confidence region shaded. The MPN (the reciprocal of the Poisson distribution parameter λ) is revealed as the abscissa coordinate (dashed arrow) of the point of intersection between 1/e and the regression line; it gives us the number of transcripts that need to be seeded for detection. 95% CI, 95% confidence interval of MPN; P, probability value indicating the goodness of fit.
FIG. 10.
FIG. 10.
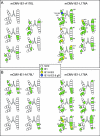
Contextual analysis of transcription in latently infected lungs. (A) First BMT experiment performed with mutant mCMV-IE1-L176A and the authentic revertant mCMV-IE1-A176L. The analysis was performed at 1 year after BMT and infection. (B) Second BMT experiment performed with mutant mCMV-IE1-L176A and the wobble revertant mCMV-IE1-A176L*. The analysis was performed at 8 months after BMT and infection. Transcripts were quantified for each of the illustrated lung pieces, for seven pieces of each left lung, and for nine pieces of each right lung, comprising superior lobe, middle lobe, and inferior lobe. Color codes are explained by the insert legend. Numbers at the pieces give the numbers of IE1/IE3/gB transcripts determined by the respective real-time quantitative RT-PCRs for 1/10 aliquots of the yield (per piece) of poly(A)+ RNA.
FIG. 11.
FIG. 11.
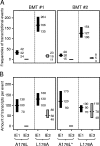
Summary of data for transcription in latently infected lungs. (A) Frequencies (point prevalences) of transcription. Based on the fraction of pieces determined to be negative for a particular type of transcript (see Fig. 10, i.e., uncolored pieces for the absence of IE1 transcripts and uncolored pieces plus green pieces for the absence of IE3 transcripts), the Poisson distribution function was employed to estimate the total number of transcriptional events. Black (for IE1) and gray-shaded (for IE3) bars represent the frequencies (MPN values and their 95% confidence intervals) extrapolated to 180 pieces of 10 lungs. (B) Numbers of transcripts present per transcriptional event. The experimentally determined numbers of transcripts in lung tissue pieces (see Fig. 10; the singular gB-positive piece shown in Fig. 10A was excluded from the calculation) were added up, multiplied with the yield factor of 10, extrapolated to 180 pieces of 10 lungs, and divided by the number of transcriptional events per 10 lungs (see panel A). Black (for IE1) and gray-shaded (for IE3) bars represent the MPNs of transcripts and their 95% confidence intervals.
FIG. 12.
FIG. 12.
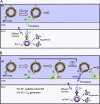
Refined model of the silencing/desilencing and immune sensing hypothesis of CMV latency and reactivation. (A) Viral latency after infection of BALB/c (H-2d haplotype) mice with mCMV-WT or mCMV-IE1-A176L (or L*) revertants. Most latent viral genomes (symbolized as episomes associated with histones) are silenced at the MIE locus (MIE locus latency). A low incidence of local desilencing (forward arrow) leads to MIE transcription (MIE locus reactivation), splicing of IE1 transcripts (green wavy line), antigenic processing of IE1 protein, presentation of IE1 peptide 168-YPHFMPTNL-176 (green triangle) by MHC class I molecule Ld at the cell surface, and recognition by IE1 epitope-specific effector-memory CD8 T cells (IE1-TEM). Due to the restimulation, these IE1-TEM undergo clonal expansion, and delivery of effector function(s) terminates the viral reactivation. It is still open to question (see Discussion) whether IE1-expressing cells are eliminated or whether desilenced viral genomes fall back into the pool of silenced/latent viral genomes (backward arrow). As a consequence of IE1-TEM effector function at this first immunological checkpoint, the experimentally determined point prevalence of IE1 transcription (Fig. 10 and 11) necessarily underestimates the incidence of MIE locus desilencing. NC, nuclear compartment; CYC, cytoplasmic compartment; ECC, extracellular compartment. Arrowhead, position of gene m01. (B) Viral latency after infection of BALB/c mice with mutant virus mCMV-IE1-L176A. MIE locus desilencing is proposed to occur with the same incidence (forward arrow) as that during latency of mCMV-WT. However, as the mutated IE1 RNA (green wavy line with red dot) does not encode a functional IE1 peptide and thus revokes the first immunological checkpoint, MIE locus reactivation is not recognized and therefore not terminated, which results in an increased point prevalence of IE1 transcription (Fig. 10 and 11). With a reduced incidence (smaller forward arrow), transcriptional reactivation proceeds to IE3 splicing (yellow wavy line), but IE3 does not specify an MHC class I-restricted antigenic peptide for the H-2d haplotype. Accordingly, it is not recognized by CD8 T cells in the BALB/c model. It is proposed that transcriptional reactivation further proceeds with an unknown incidence (question mark symbol; smallest forward arrow) to a second immunological checkpoint located in the E phase. The m164 transcript (blue wavy line) specifies the Dd-restricted antigenic peptide 257-AGPPRYSRI-265 (blue triangle). Its recognition leads to clonal expansion of m164-TEM and to the termination of transcriptional reactivation. As a consequence of m164-TEM effector function at this second immunological checkpoint, the incidences of m164 transcription as well as of all preceding transcriptions are necessarily underestimated (backward arrow) in experiments measuring the respective point prevalences. In an extrapolation of the model, further immunological checkpoints might exist downstream of m164, although at present no corresponding peptides that would cause significant CD8 T-cell expansions during latency are known for the H-2d haplotype.

Similar articles

Cited by

References

    1. Angulo, A., P. Ghazal, and M. Messerle. 2000. The major immediate-early gene ie3 of mouse cytomegalovirus is essential for viral growth. J. Virol. 74:11129-11136. - PMC - PubMed
    1. Ash, J., W.-C. Liao, Y. Ke, and L. F. Johnson. 1995. Regulation of mouse thymidylate synthase gene expression in growth-stimulated cells: upstream S phase control elements are indistinguishable from essential promoter elements. Nucleic Acids Res. 23:4649-4656. - PMC - PubMed
    1. Bain, M., M. Reeves, and J. Sinclair. 2006. Regulation of human cytomegalovirus gene expression by chromatin remodeling, p. 167-183. In M. J. Reddehase (ed.), Cytomegaloviruses: molecular biology and immunology. Caister Academic Press, Wymondham, Norfolk, United Kingdom.
    1. Balthesen, M., M. Messerle, and M. J. Reddehase. 1993. Lungs are a major organ site of cytomegalovirus latency and recurrence. J. Virol. 67:5360-5366. - PMC - PubMed
    1. Bolovan-Fritts, C. A., E. S. Mocarski, and J. A. Wiedeman. 1999. Peripheral blood CD14+ cells from healthy subjects carry a circular conformation of latent cytomegalovirus genome. Blood 93:394-398. - PubMed

Publication types

MeSH terms