. 2006 Nov-Dec;13(6):608-18.
doi: 10.1197/jamia.M2115. Epub 2006 Aug 23.

Design features of graphs in health risk communication: a systematic review

Affiliations

Design features of graphs in health risk communication: a systematic review

Jessica S Ancker et al. J Am Med Inform Assoc. 2006 Nov-Dec.

Abstract

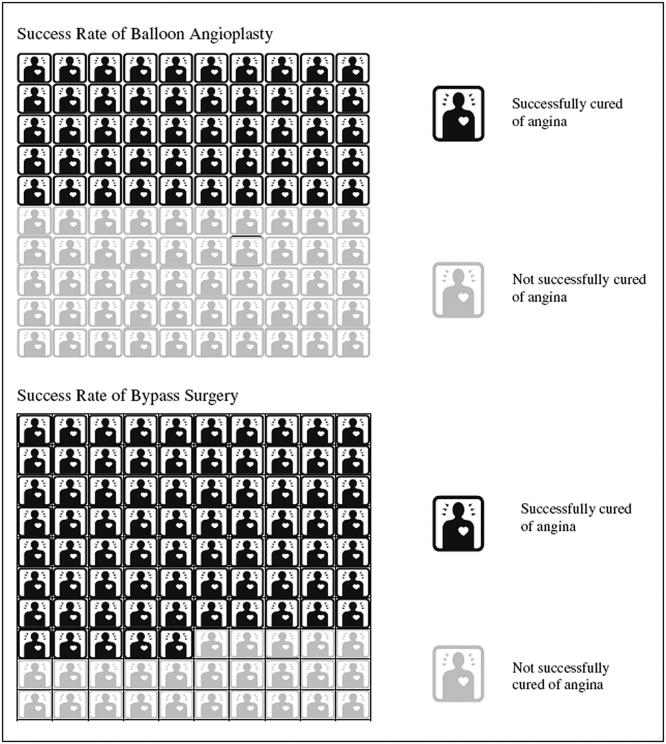
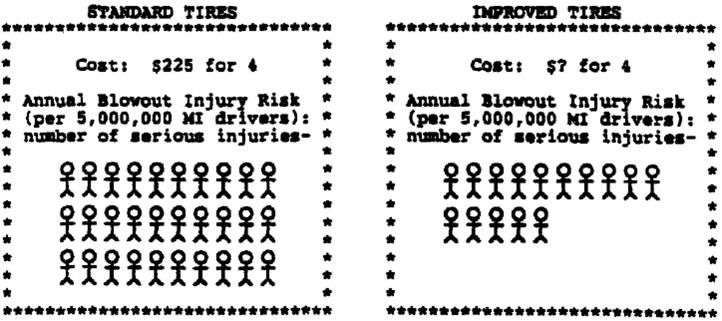
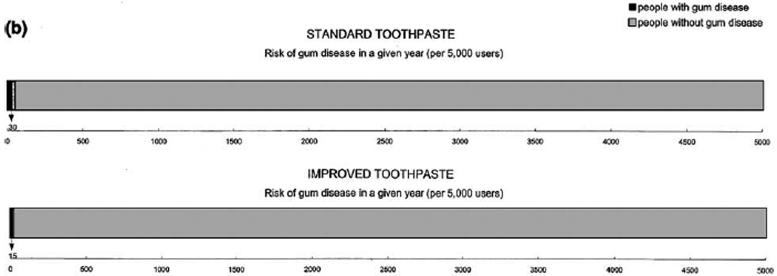
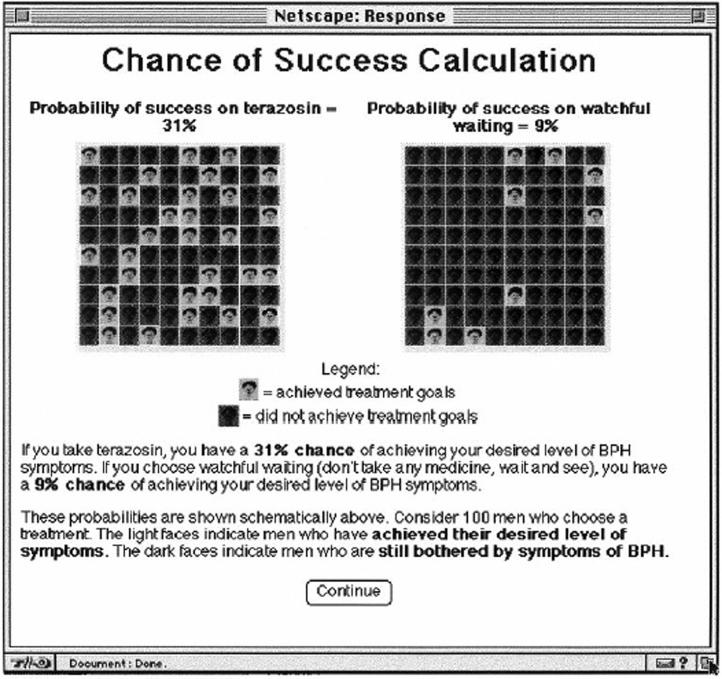
This review describes recent experimental and focus group research on graphics as a method of communication about quantitative health risks. Some of the studies discussed in this review assessed effect of graphs on quantitative reasoning, others assessed effects on behavior or behavioral intentions, and still others assessed viewers' likes and dislikes. Graphical features that improve the accuracy of quantitative reasoning appear to differ from the features most likely to alter behavior or intentions. For example, graphs that make part-to-whole relationships available visually may help people attend to the relationship between the numerator (the number of people affected by a hazard) and the denominator (the entire population at risk), whereas graphs that show only the numerator appear to inflate the perceived risk and may induce risk-averse behavior. Viewers often preferred design features such as visual simplicity and familiarity that were not associated with accurate quantitative judgments. Communicators should not assume that all graphics are more intuitive than text; many of the studies found that patients' interpretations of the graphics were dependent upon expertise or instruction. Potentially useful directions for continuing research include interactions with educational level and numeracy and successful ways to communicate uncertainty about risk.


Figures

Figure 1
Figure 1
Part-to-whole icon array with sequential arrangement. Proportions are easy to judge in this icon array because the part-to-whole information is available visually. Because the square icons are arranged as a block and are touching each other, it is possible that they are visually processed as areas rather than as discrete units. From Fagerlin A, Wang C, Ubel PA. Reducing the influence of anecdotal reasoning on people’s health care decisions: Is a picture worth a thousand statistics? Med Decis Making 2005;25:398–405. Copyright 2005 by Sage Publications. Reprinted by permission of Sage Publications, Inc.
Figure 2
Figure 2
Icon array without part-to-whole information. In this pair of discrete icon arrays, the part-to-whole relationship (those injured in relation to the entire group at risk) is not available visually. The difference between the risks is thus emphasized. Reprinted with permission from p. 250 of Stone ER, Yates JF, Parker AM. Effects of numerical and graphical displays on professed risk-taking behavior. J Exp Psychol: Appl. 1997;3(4):243–56 (published by the American Psychological Association).
Figure 3
Figure 3
Part-to-whole bar graph. The part-to-whole relationship is available visually in this stacked bar chart; this arrangement did not appear to emphasize the difference between the two risks. Reprinted from p. 28 of Stone ER, Sieck WR, Bull BE, Yates JF, Parks SC, & Rush CJ. Foreground:background salience: Explaining the effects of graphical displays on risk avoidance. Org Behav Hum Decis Proc. 2003;90(1):19–36, with permission from Elsevier.
Figure 4
Figure 4
Random-arrangement icon array. The individuals affected by the risk are scattered among the whole group. The proportion affected is more difficult to judge, but some studies suggest that this arrangement better conveys the idea of chance. Reprinted from p. 415 of Lenert LA, Cher DJ. Use of meta-analytic results to facilitate shared decision making. JAMIA 1999;6(5):412–9. Reprinted with permission from the American Medical Informatics Association.
Figure 5
Figure 5
Risk scale with comparative risks. This scale was used for demonstrating risk magnitudes; how viewers interpret the logarithmic scale is not known. Reprinted with permission from Blackwell Publishing from page 787 of Lee DH, Mehta MD. Evaluation of a visual risk communication tool: effects on knowledge and perception of blood transfusion risk. Transfusion 2003;43:779–87.
Figure 6
Figure 6
Magnifier risk scale. This scale was used for eliciting risk perceptions. The magnifying lens at the low end allowed users to respond with smaller values for very low risks; a second study suggests that it reduces the magnitude of higher risks as well. From Woloshin S, Schwartz LM, Byram S, Fischhoff B, Welch HG. A new scale for assessing perceptions of chance: A validation study. Med Decis Making 2000;20(3):298–307. Copyright 2000 by Sage Publications. Reprinted by permission of Sage Publications, Inc.
Figure 7
Figure 7
Survival curves. Distance between survival curves, rather than the arithmetic difference in survival, predicts viewers’ estimates of the effectiveness of the treatments. The top figure shows 15-year survival curves for a fictitious disease; the bottom shows only the first 5 years of data, stretched to fill the same width, which reduces the distance between curves. Reprinted with permission from Blackwell Publishing from page 590 of Zikmund-Fisher et al. (2005) What’s time got to do with it? Inattention to duration in interpretation of survival graphs. Risk Anal 2005;25(3):589–95.

References

    1. Kaplan RM. Shared medical decision making: a new tool for preventive medicine Am J Prevent Med 2004;26(1):81-83. - PubMed
    1. U.S.D.H.H.S. U.S. Department of Health and Human Services Tracking Healthy People 2010. Washington, DC: U.S. Government Printing Office; 2000. November.
    1. Rothman AJ, Kiviniemi MT. Treating people with information: an analysis and review of approaches to communicating health risk information JNCI Monographs 1999;25:44-51. - PubMed
    1. Tversky A, Kahneman D. Judgment under uncertainty: heuristics and biases Science 1974(185):1124-1130. - PubMed
    1. Cosmides L, Tooby J. Are humans good intuitive statisticians after all? Rethinking some conclusions from the literature on judgment under uncertainty Cognition 1996;58:1-73.

Publication types