. 2006 Aug;24(4):1124-36.
doi: 10.1111/j.1460-9568.2006.04988.x.

External tufted cells in the main olfactory bulb form two distinct subpopulations

Affiliations

External tufted cells in the main olfactory bulb form two distinct subpopulations

Miklós Antal et al. Eur J Neurosci. 2006 Aug.

Abstract

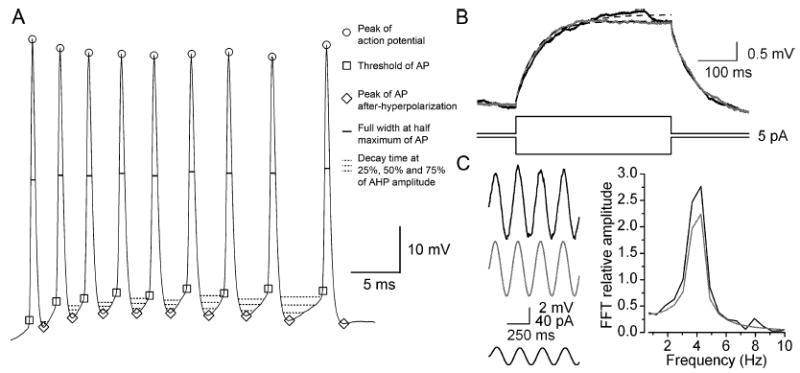
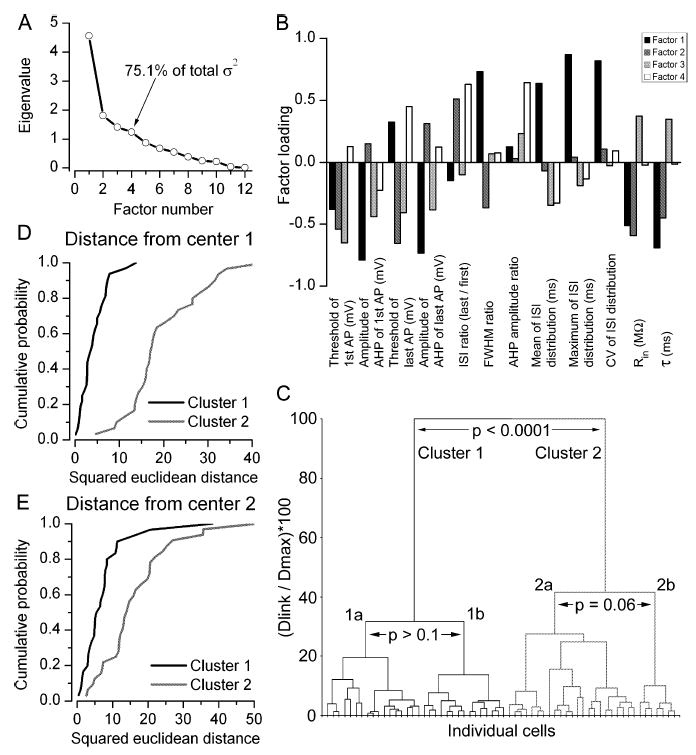
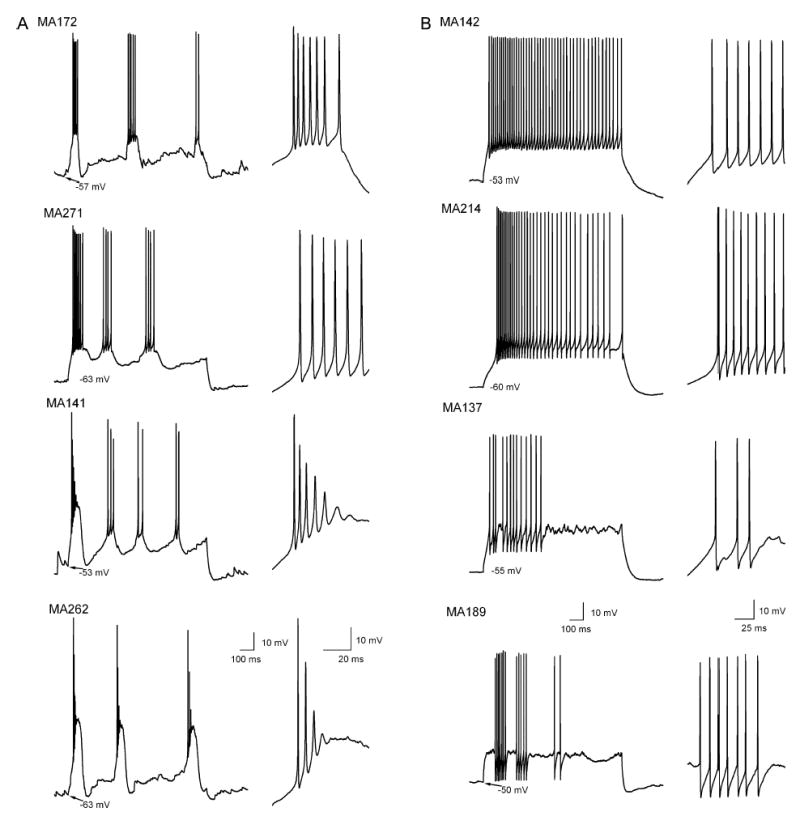
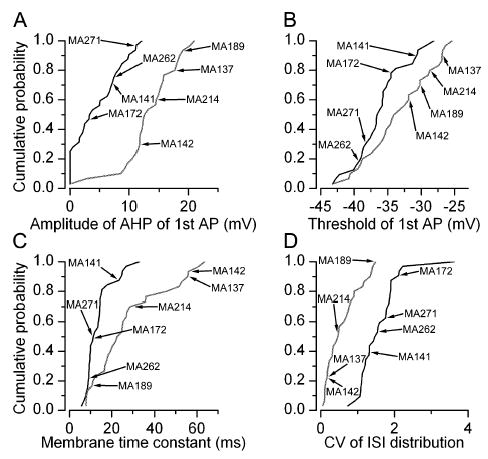
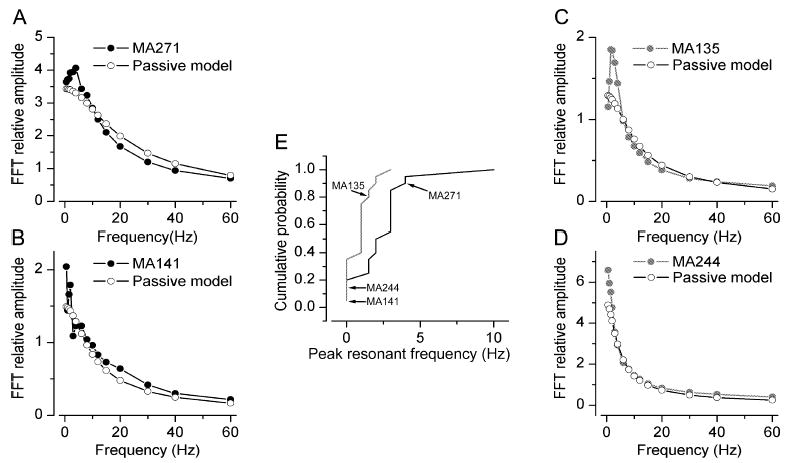
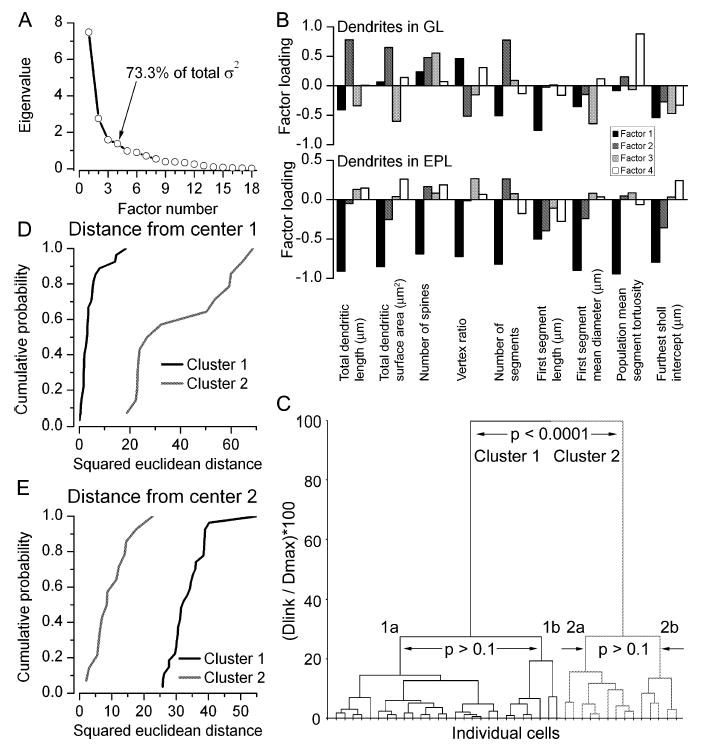
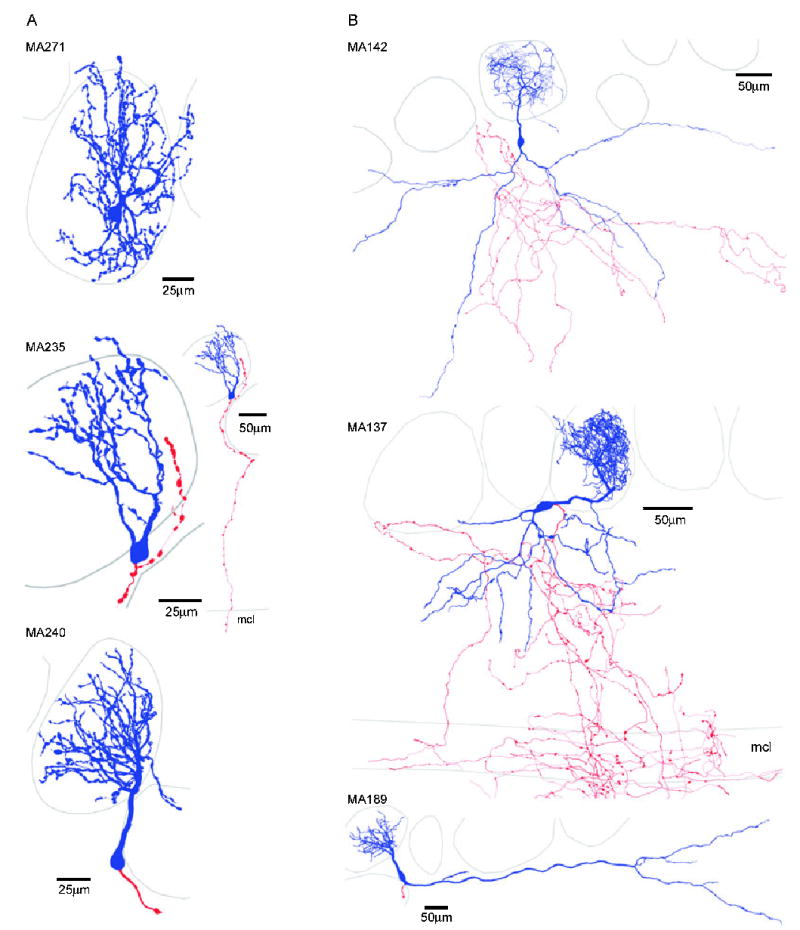
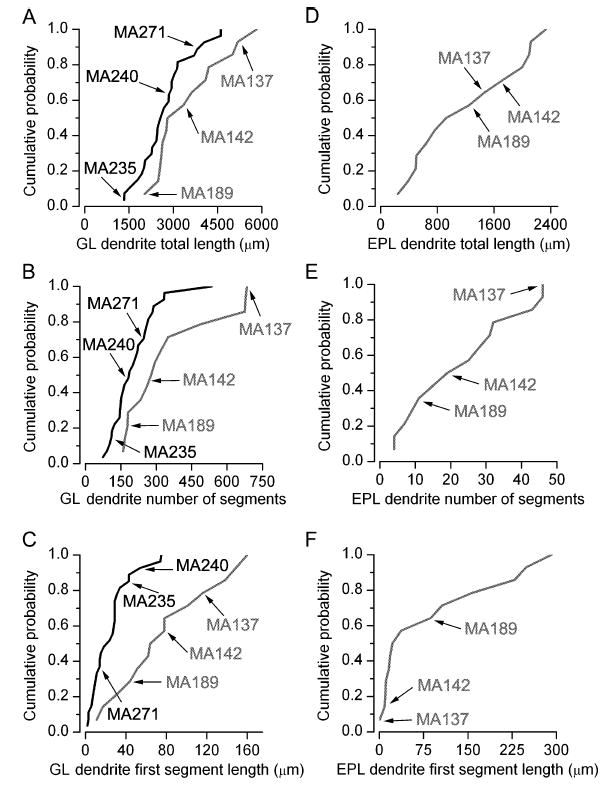
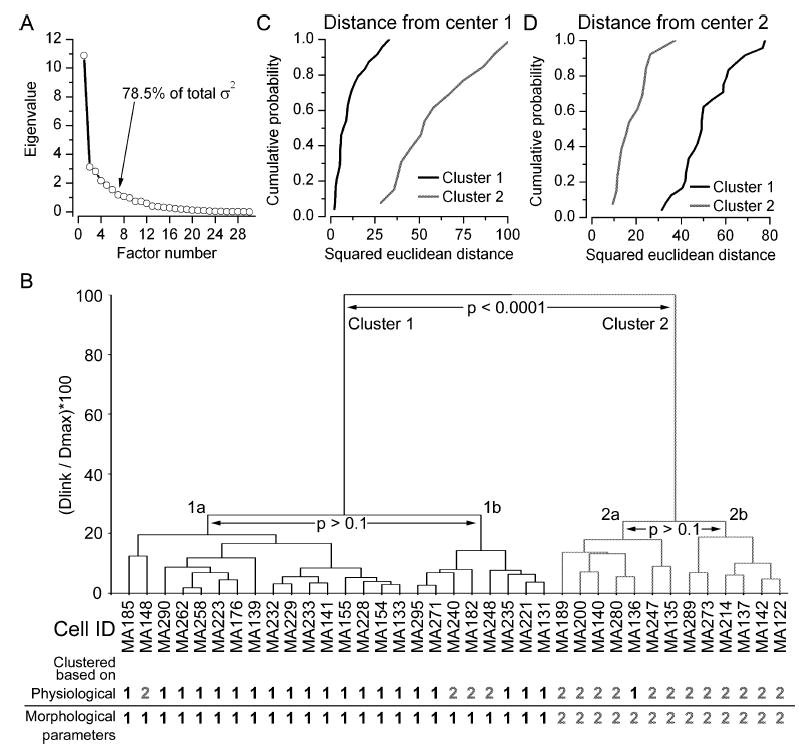
The glomeruli of the main olfactory bulb are the first processing station of the olfactory pathway, where complex interactions occur between sensory axons, mitral cells and a variety of juxtaglomerular neurons, including external tufted cells (ETCs). Despite a number of studies characterizing ETCs, little is known about how their morphological and functional properties correspond to each other. Here we determined the active and passive electrical properties of ETCs using in vitro whole-cell recordings, and correlated them with their dendritic arborization patterns. Principal component followed by cluster analysis revealed two distinct subpopulations of ETCs based on their electrophysiological properties. Eight out of 12 measured physiological parameters exhibited significant difference between the two subpopulations, including the membrane time constant, amplitude of spike afterhyperpolarization, variance in the interspike interval distribution and subthreshold resonance. Cluster analysis of the morphological properties of the cells also revealed two subpopulations, the most prominent dissimilarity between the groups being the presence or absence of secondary, basal dendrites. Finally, clustering the cells taking all measured properties into account also indicated the presence of two subpopulations that mapped in an almost perfect one-to-one fashion to both the physiologically and the morphologically derived groups. Our results demonstrate that a number of functional and structural properties of ETCs are highly predictive of one another. However, cells within each subpopulation exhibit pronounced variability, suggesting a large degree of specialization evolved to fulfil specific functional requirements in olfactory information processing.


Figures

Fig. 1
Fig. 1
Measurements of physiological properties of ETCs. (A) Somatic DC current injection-evoked spike train is shown. Parameters such as the AP threshold, peak amplitude, full width at half maximum, AP afterhyperpolarization amplitude and width at 25, 50 and 75% decay were automatically measured with custom-made software. (B) Passive membrane properties (Rin and τ) of ETCs were derived from single exponential fits (broken lines) to averaged (of 50–100 traces) voltage responses to small (1–20 pA, 400 ms) hyper- (shaded trace, inverted) and depolarizing (solid trace) current injections. (C) For testing subthreshold resonance, 2-s-long sinusoidal currents (0.5–60 Hz, 5–40 pA, 2 s) were injected into the cells (bottom solid trace). The voltage responses of the cells (solid trace) were then compared to responses of a single-compartment model cell with passive membrane properties (shaded trace) following fast Fourier transformation. (ETC response, solid; passive model, shaded).
Fig. 2
Fig. 2
PCA and cluster analysis of the recorded cells based on their physiology parameters. (A) Scree plot of the eigenvalues derived from PCA of 12 physiological parameters. The first four factors had eigenvalues > 1 and together accounted for 75.1% of the total variance. (B) Factor loading plot showing the contribution of the 12 physiological parameters to each of the first four factors. (C) Joining tree of agglomerative clustering using the first four principal component factor scores for each cell. Individual cells are illustrated on the x-axis and the y-axis shows the percentage of the maximum Euclidean distance between any two cells. Clusters 1 and 2 differ significantly from each other. (D) Cumulative probability plots of squared Euclidean distances of each cell in clusters 1 (solid) and 2 (shaded) from the centre of cluster 1. The distributions are statistically significantly different (P < 0.001, Mann–Whitney test). (E) Similar plot as in panel D, but distances of cells in clusters 1 and 2 are shown from the centre of cluster 2. The distributions are statistically significant (P < 0.001, Mann–Whitney test). σ2, variance; FWHM, full width at half maximum amplitude; Dlink, linkage distance; Dmax, maximum linkage distance.
Fig. 3
Fig. 3
Diverse AP firing patterns of individual ETCs. Whole-cell voltage recordings of suprathreshold responses to depolarizing current injections from ETCs. Although the firing patterns of the members of (A) cluster 1 are clearly different from those in (B) cluster 2, large within-group variability is also apparent. In all panels, the first part of the trace is shown on an expanded timescale on the right.
Fig. 4
Fig. 4
Between- and within-cluster variability in physiological parameters. (A–D) Cumulative probability plots of four parameters (cluster 1, solid; cluster 2, shaded), showing significant difference between the two ETC subpopulations. Each parameter varied considerably within each cluster (CVs ranging from 0.34 to 0.88), resulting in some overlap between the subpopulations. The positions of the cells illustrated in Fig. 3 are marked in each panel.
Fig. 5
Fig. 5
ETCs significantly differed with regard to their subthreshold resonant behaviour. (A–D) Plots of frequency against fast Fourier transform relative amplitude for four individual cells (solid and shaded symbols). For comparison the behaviour of passive model cells are shown (open symbols). The peak resonant frequency was determined from these plots. Cells in panels A and B belong to cluster 1 and those in C and D to cluster 2. (E) Cumulative probability plot of peak resonant frequencies for cells in cluster 1 (solid) and cluster 2 (shaded). The two subpopulations are significantly different (P < 0.002, Mann–Whitney U-test).
Fig. 6
Fig. 6
PCA and cluster analysis of the recorded cells based on their morphological properties. (A) Scree plot of the eigenvalues derived from PCA of the 18 morphological parameters. The first four factors had eigenvalues > 1, and together account for 73.3% of the total variance. (B) Factor loading plots demonstrate the contribution of the 18 variables, nine for dendrites in the GL and nine for dendrites in the EPL, to each of the four factors. (C) Joining tree of agglomerative clustering using the first four principal component factor scores for each cell. Individual cells are shown on the x-axis. Clusters 1 and 2 are significantly different from each other. However, further subdivision of the clusters is not justified (neither clusters 1a and 1b nor clusters 2a and 2b are significantly different). (D) Cumulative probability plot of squared Euclidean distances of cells in clusters 1 (solid) and 2 (shaded) from the centre of cluster 1. (E) Cumulative probability plot of squared Euclidean distances of cells in clusters 1 (solid) and 2 (shaded) from the centre of cluster 2; σ2, variance. The vertex ratio is a measure of the branching pattern of the dendrites; tortuosity is the ratio of the length along a dendritic segment to the shortest distance in 3-D between the two ends of the segment; furthest Sholl intercept is the radius of the largest virtual sphere centred on the soma that is still intercepted by the dendrite. Dlink, linkage distance; Dmax, maximum linkage distance.
Fig. 7
Fig. 7
ETCs possessed distinct dendritic arborization patterns. Two-dimensional projections of 3-D reconstructed ETCs with somata and dendrites indicated in blue and the axon in red. The most pronounced difference between the cells in (A) cluster 1 and (B) cluster 2 was the absence of basal dendrites in the EPL of the cells in cluster 1. Cells within each subpopulation showed large diversity based on the total length, number of segments and arborization pattern of their apical tufts. The basal dendrites of ETCs in cluster 2 could also be remarkably different. Note the extensive axonal arbors of MA137 and MA142 in the EPL, MCL, IPL and GCL. The axon of MA235 also projected out through the EPL and MCL. The physiological properties of some of these cells are illustrated in Figs 3–5.
Fig. 8
Fig. 8
Quantitative comparisons of the morphological parameters between and within ETC subpopulations. Fifteen out of 18 parameters significantly differed between clusters 1 (solid) and 2 (shaded). Some of these parameters include the total dendritic length in (A) GL and (D) EPL, the number of dendritic segments in (B) GL and (E) EPL, and the first segment length in (C) GL and (F) EPL. Each parameter varied considerably within each subpopulation (CVs ranging from 0.32 to 1.15). (D–F) Cumulative probability distributions of EPL dendrites of cells in cluster 1 are not shown because they lacked such dendrites.
Fig. 9
Fig. 9
PCA and cluster analysis of the recorded cells based on both physiological and morphological properties. (A) Scree plot of the eigenvalues derived from PCA of the 30 variables (12 functional and 18 structural). The first seven factors together accounted for 78.5% of the total variance. (B) Joining tree of agglomerative clustering using the first seven principal component factor scores for each cell (37 cells in total for which all 30 parameters were determined). The individual cells are shown on the x-axis and the normalized maximum Euclidean distances between any two cells are shown on the y-axis. At the bottom, the group membership of each cell is shown based on clustering of either only the physiological or only the morphological parameters. Note the almost perfect matching between the three ways of clustering. (C) Cumulative probability plot of squared Euclidean distances of cells in clusters 1 (solid) and 2 (shaded) from the centre of cluster 1. (D) Cumulative probability plot of squared Euclidean distances of cells in clusters 1 (solid) and 2 (shaded) from the centre of cluster 2. The distributions in both panels C and D are significantly different from each other (Mann–Whitney, P < 0.001). σ2, variance; Dlink, linkage distance; Dmax, maximum linkage distance.

References

    1. Adrian ED. The electrical activity of the mammalian olfactory bulb. Electroencephalogr Clin Neurophysiol. 1950;2:377–388. - PubMed
    1. Aungst JL, Heyward PM, Puche AC, Karnup SV, Hayar A, Szabo G, Shipley MT. Centre-surround inhibition among olfactory bulb glomeruli. Nature. 2003;426:623–629. - PubMed
    1. Cajal, S.R. & y. (1911) Histologie Du Systeme Nerveux de l’Homme et Des Vertebres Maloine, Paris.
    1. Desmaisons D, Vincent JD, Lledo PM. Control of action potential timing by intrinsic subthreshold oscillations in olfactssory bulb output neurons. J Neurosci. 1999;19:10727–10737. - PMC - PubMed
    1. Freeman, W.J. (1975) Mass Action in the Nervous System Academic Press, New York.

Publication types