. 2006 Aug 24:7:389.
doi: 10.1186/1471-2105-7-389.

Fast index based algorithms and software for matching position specific scoring matrices

Affiliations

Fast index based algorithms and software for matching position specific scoring matrices

Michael Beckstette et al. BMC Bioinformatics. .

Abstract

Background: In biological sequence analysis, position specific scoring matrices (PSSMs) are widely used to represent sequence motifs in nucleotide as well as amino acid sequences. Searching with PSSMs in complete genomes or large sequence databases is a common, but computationally expensive task.

Results: We present a new non-heuristic algorithm, called ESAsearch, to efficiently find matches of PSSMs in large databases. Our approach preprocesses the search space, e.g., a complete genome or a set of protein sequences, and builds an enhanced suffix array that is stored on file. This allows the searching of a database with a PSSM in sublinear expected time. Since ESAsearch benefits from small alphabets, we present a variant operating on sequences recoded according to a reduced alphabet. We also address the problem of non-comparable PSSM-scores by developing a method which allows the efficient computation of a matrix similarity threshold for a PSSM, given an E-value or a p-value. Our method is based on dynamic programming and, in contrast to other methods, it employs lazy evaluation of the dynamic programming matrix. We evaluated algorithm ESAsearch with nucleotide PSSMs and with amino acid PSSMs. Compared to the best previous methods, ESAsearch shows speedups of a factor between 17 and 275 for nucleotide PSSMs, and speedups up to factor 1.8 for amino acid PSSMs. Comparisons with the most widely used programs even show speedups by a factor of at least 3.8. Alphabet reduction yields an additional speedup factor of 2 on amino acid sequences compared to results achieved with the 20 symbol standard alphabet. The lazy evaluation method is also much faster than previous methods, with speedups of a factor between 3 and 330.

Conclusion: Our analysis of ESAsearch reveals sublinear runtime in the expected case, and linear runtime in the worst case for sequences not shorter than the absolute value of A(m) + m - 1, where m is the length of the PSSM and A a finite alphabet. In practice, ESAsearch shows superior performance over the most widely used programs, especially for DNA sequences. The new algorithm for accurate on-the-fly calculations of thresholds has the potential to replace formerly used approximation approaches. Beyond the algorithmic contributions, we provide a robust, well documented, and easy to use software package, implementing the ideas and algorithms presented in this manuscript.


Figures

Figure 1
Figure 1
Amino acid PSSM. Amino acid PSSM of length m = 10 of a zinc-finger motif. If the score threshold is th = 400, then only substrings beginning with C or V can match the PSSM, because all other amino acids score below the intermediate threshold th0 = th - σ0 = 400 - 398 = 2. That is, lookahead scoring will skip over all substrings which begin with amino acids different from C and V. Here σd, d ∈ [0, m - 1] denotes the maximal score that can be achieved in the last m - d - 1 positions of the PSSM as defined in the text.
Figure 2
Figure 2
Relationship between enhanced suffix array and suffix tree. The enhanced suffix array consisting of tables suf, lcp, skp (left) and the suffix tree (right) for sequence S = caaaaccacac. Some skp entries are shown in the tree as red arrows: If skp[i] = j, then an arrow points from row i to row j. For clarity, suffixes corresponding to suf[i] are given in table Ssuf[i].
Figure 3
Figure 3
Algorithm ESAsearch. The algorithm ESAsearch formulated in pseudocode. See text for detailed explanations of the used notions.
Figure 4
Figure 4
Function skipchain of the ESAsearch algorithm. Function skipchain computes a chain of entries in table skp to skip certain ranges of suffixes in table suf.
Figure 5
Figure 5
Minimum size enhanced suffix arrays for worst case analysis. Enhanced suffix arrays for text S = cagataaccgtcttggc, consisting of all strings of length m = 2 over an alphabet of size 4, and T = ccaaacaccc, consisting of all strings of length m = 3 over an alphabet of size 2.
Figure 6
Figure 6
Number of ℓ-intervals for various reduced alphabets. Numbers of ℓ-intervals for ℓ ∈ [1, 20] of different length for various reduced alphabets. We built the enhanced suffix array with sequences from the RCSB protein data bank (PDB) (total sequence length 4,264,239 bytes). The used reduced amino acid alphabets are given in Figure 8. Note that we limited the interval lengths in the figures to 5,000 to prevent distortion.
Figure 7
Figure 7
PSSM alphabet transformation. In the left PSSM M we used the normal four letter nucleotide alphabet A MathType@MTEF@5@5@+=feaafiart1ev1aaatCvAUfKttLearuWrP9MDH5MBPbIqV92AaeXatLxBI9gBamrtHrhAL1wy0L2yHvtyaeHbnfgDOvwBHrxAJfwnaebbnrfifHhDYfgasaacH8akY=wiFfYdH8Gipec8Eeeu0xXdbba9frFj0=OqFfea0dXdd9vqai=hGuQ8kuc9pgc9s8qqaq=dirpe0xb9q8qiLsFr0=vr0=vr0dc8meaabaqaciaacaGaaeqabaWaaeGaeaaakeaaimaacqWFaeFqaaa@3821@ = {A, C, G, T} to describe a transcription factor binding site found in Hox A3 gene promoters. In the right PSSM M_ MathType@MTEF@5@5@+=feaafiart1ev1aaatCvAUfKttLearuWrP9MDH5MBPbIqV92AaeXatLxBI9gBaebbnrfifHhDYfgasaacH8akY=wiFfYdH8Gipec8Eeeu0xXdbba9frFj0=OqFfea0dXdd9vqai=hGuQ8kuc9pgc9s8qqaq=dirpe0xb9q8qiLsFr0=vr0=vr0dc8meaabaqaciaacaGaaeqabaqabeGadaaakeaadaqiaaqaaiabd2eanbGaayPadaaaaa@2E91@ we used a reduced two letter alphabet A_ MathType@MTEF@5@5@+=feaafiart1ev1aaatCvAUfKttLearuWrP9MDH5MBPbIqV92AaeXatLxBI9gBamrtHrhAL1wy0L2yHvtyaeHbnfgDOvwBHrxAJfwnaebbnrfifHhDYfgasaacH8akY=wiFfYdH8Gipec8Eeeu0xXdbba9frFj0=OqFfea0dXdd9vqai=hGuQ8kuc9pgc9s8qqaq=dirpe0xb9q8qiLsFr0=vr0=vr0dc8meaabaqaciaacaGaaeqabaWaaeGaeaaakeaadaqiaaqaaGWaaiab=bq8bbGaayPadaaaaa@38E3@ = {P, Y} that differs only between purine (adenine or guanine) and pyrimidine (cytosine or thymine) nucleotides. Hence we have two character classes: Φ-1(P) = {A, G} and Φ-1(Y) = {C, T}. Consequently M_ MathType@MTEF@5@5@+=feaafiart1ev1aaatCvAUfKttLearuWrP9MDH5MBPbIqV92AaeXatLxBI9gBaebbnrfifHhDYfgasaacH8akY=wiFfYdH8Gipec8Eeeu0xXdbba9frFj0=OqFfea0dXdd9vqai=hGuQ8kuc9pgc9s8qqaq=dirpe0xb9q8qiLsFr0=vr0=vr0dc8meaabaqaciaacaGaaeqabaqabeGadaaakeaadaqiaaqaaiabd2eanbGaayPadaaaaa@2E91@(i, P) = max{M(i, a) | a ∈ {A, G}} and M_ MathType@MTEF@5@5@+=feaafiart1ev1aaatCvAUfKttLearuWrP9MDH5MBPbIqV92AaeXatLxBI9gBaebbnrfifHhDYfgasaacH8akY=wiFfYdH8Gipec8Eeeu0xXdbba9frFj0=OqFfea0dXdd9vqai=hGuQ8kuc9pgc9s8qqaq=dirpe0xb9q8qiLsFr0=vr0=vr0dc8meaabaqaciaacaGaaeqabaqabeGadaaakeaadaqiaaqaaiabd2eanbGaayPadaaaaa@2E91@(i, Y) = max{M(i, a) | a ∈ {C, T}} ∀i ∈ [0, 8]
Figure 8
Figure 8
Schemes for amino acid alphabet reduction. Reduction of the amino acid alphabet into smaller groups. Amino acid pairs are iteratively grouped together based on ther correlations ca,b (see text for the definition of ca,b), starting with the most correlated pairs, until al amino acids are divided into the desired number of groups. Here we used BLOSUM50 similarities for the determination of ca,b. Observe that, hydrophobic amino acids, especially (LVIM) and (FYW) are conserved in many reduced alphabets. The same is true for the polar (ST), (EDNQ), and (KR) groups. The smallest alphabet contains two groups that can be categorized broadly as hydrophobic/small (LVIMCAGSTPFYW) and hydrophilic (EDNQKRH).
Figure 9
Figure 9
Score distribution of TRANSFAC PSSM M00734. Histogram, cumulative score distribution function, X-Y plot, and normal probability plot of TRANSFAC PSSM M00734 (PSSM length m = 9).
Figure 10
Figure 10
Score distribution of BLOCKS PSSM IPB003211A. Histogram, cumulative score distribution, X-Y plot, and normal probability plot of a PSSM taken from the BLOCKS database (Accession: IPB003211A; PSSM length m = 40), describing the UreI protein of Helicobacter pylori, a proton gated urea channel [36].
Figure 11
Figure 11
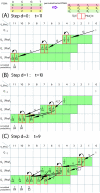
Evaluation with dynamic programming. The simple DP scheme computes all probability vectors Q0, Q1, Q2 completely within the green marked area, corresponding to score ranges of prefix PSSMs Mk. In contrast to the simple scheme, the restricted probability computation method computes only the upper end of the probability distribution until the given p-value threshold is exceeded, omitting parts of the green area. In this example we show how to compute the score threshold TminP MathType@MTEF@5@5@+=feaafiart1ev1aaatCvAUfKttLearuWrP9MDH5MBPbIqV92AaeXatLxBI9gBamrtHrhAL1wy0L2yHvtyaeHbnfgDOvwBHrxAJfwnaebbnrfifHhDYfgasaacH8akY=wiFfYdH8Gipec8Eeeu0xXdbba9frFj0=OqFfea0dXdd9vqai=hGuQ8kuc9pgc9s8qqaq=dirpe0xb9q8qiLsFr0=vr0=vr0dc8meaabaqaciaacaGaaeqabaWaaeGaeaaakeaacqWGubavieGacqWFTbqBcqWFPbqAcqWFUbGBdaWgaaWcbaGaemiuaafabeaaaaa@3D07@(π, M) for PSSM M of length m = 3 and a score range of [4,11] corresponding to a given p-value threshold of π = 18 MathType@MTEF@5@5@+=feaafiart1ev1aaatCvAUfKttLearuWrP9MDH5MBPbIqV92AaeXatLxBI9gBaebbnrfifHhDYfgasaacH8akY=wiFfYdH8Gipec8Eeeu0xXdbba9frFj0=OqFfea0dXdd9vqai=hGuQ8kuc9pgc9s8qqaq=dirpe0xb9q8qiLsFr0=vr0=vr0dc8meaabaqaciaacaGaaeqabaqabeGadaaakeaadaWcaaqaaiabigdaXaqaaiabiIda4aaaaaa@2EAA@. For simplicity we assume a uniform character distribution of f(A) = f(C) = f(G) = f(T) = 14 MathType@MTEF@5@5@+=feaafiart1ev1aaatCvAUfKttLearuWrP9MDH5MBPbIqV92AaeXatLxBI9gBaebbnrfifHhDYfgasaacH8akY=wiFfYdH8Gipec8Eeeu0xXdbba9frFj0=OqFfea0dXdd9vqai=hGuQ8kuc9pgc9s8qqaq=dirpe0xb9q8qiLsFr0=vr0=vr0dc8meaabaqaciaacaGaaeqabaqabeGadaaakeaadaWcaaqaaiabigdaXaqaaiabisda0aaaaaa@2EA2@. Cells of the matrix that are computed in the step actually under consideration are marked red. In step d = 0, see (A), the algorithm computes Q2(11) recursively for all paths through M that achieve a score of 11, i.e. Q2(11) = Q1(8)·f(G), Q1(8) = Q0(4)·f(G), Q0(4) = Q-1(0)·f(A) = 1·14 MathType@MTEF@5@5@+=feaafiart1ev1aaatCvAUfKttLearuWrP9MDH5MBPbIqV92AaeXatLxBI9gBaebbnrfifHhDYfgasaacH8akY=wiFfYdH8Gipec8Eeeu0xXdbba9frFj0=OqFfea0dXdd9vqai=hGuQ8kuc9pgc9s8qqaq=dirpe0xb9q8qiLsFr0=vr0=vr0dc8meaabaqaciaacaGaaeqabaqabeGadaaakeaadaWcaaqaaiabigdaXaqaaiabisda0aaaaaa@2EA2@, since AGG is the only path achieving score 11. It follows Q2(11) = 164 MathType@MTEF@5@5@+=feaafiart1ev1aaatCvAUfKttLearuWrP9MDH5MBPbIqV92AaeXatLxBI9gBaebbnrfifHhDYfgasaacH8akY=wiFfYdH8Gipec8Eeeu0xXdbba9frFj0=OqFfea0dXdd9vqai=hGuQ8kuc9pgc9s8qqaq=dirpe0xb9q8qiLsFr0=vr0=vr0dc8meaabaqaciaacaGaaeqabaqabeGadaaakeaadaWcaaqaaiabigdaXaqaaiabiAda2iabisda0aaaaaa@2F9C@. In step d = 1 all paths achieving a score of 11 - d = 10 to determine Q2(10) are computed, see (B). We conclude Q2(10) = 116 MathType@MTEF@5@5@+=feaafiart1ev1aaatCvAUfKttLearuWrP9MDH5MBPbIqV92AaeXatLxBI9gBaebbnrfifHhDYfgasaacH8akY=wiFfYdH8Gipec8Eeeu0xXdbba9frFj0=OqFfea0dXdd9vqai=hGuQ8kuc9pgc9s8qqaq=dirpe0xb9q8qiLsFr0=vr0=vr0dc8meaabaqaciaacaGaaeqabaqabeGadaaakeaadaWcaaqaaiabigdaXaqaaiabigdaXiabiAda2aaaaaa@2F96@. In this step, DP allows to reuse value Q1(8) without recomputation. In step d = 2, see (C) values Q1(7) and Q0(3) can be reused to compute Q2(9) = 564 MathType@MTEF@5@5@+=feaafiart1ev1aaatCvAUfKttLearuWrP9MDH5MBPbIqV92AaeXatLxBI9gBaebbnrfifHhDYfgasaacH8akY=wiFfYdH8Gipec8Eeeu0xXdbba9frFj0=OqFfea0dXdd9vqai=hGuQ8kuc9pgc9s8qqaq=dirpe0xb9q8qiLsFr0=vr0=vr0dc8meaabaqaciaacaGaaeqabaqabeGadaaakeaadaWcaaqaaiabiwda1aqaaiabiAda2iabisda0aaaaaa@2FA4@. In step d = 2 the cumulated probability Q2(11) + Q2(10) + Q2(9) = 532 MathType@MTEF@5@5@+=feaafiart1ev1aaatCvAUfKttLearuWrP9MDH5MBPbIqV92AaeXatLxBI9gBaebbnrfifHhDYfgasaacH8akY=wiFfYdH8Gipec8Eeeu0xXdbba9frFj0=OqFfea0dXdd9vqai=hGuQ8kuc9pgc9s8qqaq=dirpe0xb9q8qiLsFr0=vr0=vr0dc8meaabaqaciaacaGaaeqabaqabeGadaaakeaadaWcaaqaaiabiwda1aqaaiabiodaZiabikdaYaaaaaa@2F9A@ exceeds the given p-value threshold of π = 18 MathType@MTEF@5@5@+=feaafiart1ev1aaatCvAUfKttLearuWrP9MDH5MBPbIqV92AaeXatLxBI9gBaebbnrfifHhDYfgasaacH8akY=wiFfYdH8Gipec8Eeeu0xXdbba9frFj0=OqFfea0dXdd9vqai=hGuQ8kuc9pgc9s8qqaq=dirpe0xb9q8qiLsFr0=vr0=vr0dc8meaabaqaciaacaGaaeqabaqabeGadaaakeaadaWcaaqaaiabigdaXaqaaiabiIda4aaaaaa@2EAA@, and the restricted probability computation method skips the rest of the computation. We obtain a score threshold of th = 10 correponding to π.
Figure 12
Figure 12
Restricted probability computation. Computation of the partial cumulative distribution function. Observe that in order to determine TminP MathType@MTEF@5@5@+=feaafiart1ev1aaatCvAUfKttLearuWrP9MDH5MBPbIqV92AaeXatLxBI9gBamrtHrhAL1wy0L2yHvtyaeHbnfgDOvwBHrxAJfwnaebbnrfifHhDYfgasaacH8akY=wiFfYdH8Gipec8Eeeu0xXdbba9frFj0=OqFfea0dXdd9vqai=hGuQ8kuc9pgc9s8qqaq=dirpe0xb9q8qiLsFr0=vr0=vr0dc8meaabaqaciaacaGaaeqabaWaaeGaeaaakeaacqWGubavieGacqWFTbqBcqWFPbqAcqWFUbGBdaWgaaWcbaGaemiuaafabeaaaaa@3D07@(π, M) for π = 0.3 we do not have to calculate the complete distribution in the score range [scmin(M), scmax(M)]. It is sufficient to calculate only the upper end (green area) starting with scmax(M) until ℙ[X S] ≥ π.
Figure 13
Figure 13
Probability computation using lazy evaluation ofthe DP matrix. In this example we use the same PSSM M, character distribution, and p-value threshold π = 18 MathType@MTEF@5@5@+=feaafiart1ev1aaatCvAUfKttLearuWrP9MDH5MBPbIqV92AaeXatLxBI9gBaebbnrfifHhDYfgasaacH8akY=wiFfYdH8Gipec8Eeeu0xXdbba9frFj0=OqFfea0dXdd9vqai=hGuQ8kuc9pgc9s8qqaq=dirpe0xb9q8qiLsFr0=vr0=vr0dc8meaabaqaciaacaGaaeqabaqabeGadaaakeaadaWcaaqaaiabigdaXaqaaiabiIda4aaaaaa@2EAA@ as in Figure 11. However, in each row of the PSSM the scores are sorted in descending order, and the rows are sorted with the most discriminant row coming first (see coloured PSSMs for this relationship). Observe that the LazyDistrib algorithm evaluates the DP vectors non-recursively top-down. Cells computed in the actual step are marked red. In step d = 0 the algorithm computes Q2(11) by evaluating paths through the PSSM contributing to Q2(ll), which is in this example only the high scoring path GGA. Intermediate results of Q0(4), Q1(7), and Q2(11) are collected in buffers Pbuf0(4), Pbuf1(7), and Pbuf2(11) first, and finally copied to the correponding cells in Q. See (A) for the situation after step d = 0 has been completed. In step d = 1, see (B), the algorithm computes Q2(10), starting in row k = 1 with the determination of Pbuf1(6) and Q1(6). That is, Q1(6) = Pbuf1(6) = Q0(4)·f(A) + Q0(4)·f(C) + Q0(4)·f(T) = 316 MathType@MTEF@5@5@+=feaafiart1ev1aaatCvAUfKttLearuWrP9MDH5MBPbIqV92AaeXatLxBI9gBaebbnrfifHhDYfgasaacH8akY=wiFfYdH8Gipec8Eeeu0xXdbba9frFj0=OqFfea0dXdd9vqai=hGuQ8kuc9pgc9s8qqaq=dirpe0xb9q8qiLsFr0=vr0=vr0dc8meaabaqaciaacaGaaeqabaqabeGadaaakeaadaWcaaqaaiabiodaZaqaaiabigdaXiabiAda2aaaaaa@2F9A@. Analogously Q2(10) and Pbuf2(10) are computed based on Q1(7) and Q1(6). Additionally Pbuf2(9) is filled for further reuse in subsequent steps d + 1, d + 2,.... We compute Pbuf2(9) = Q1(6)·f(C) = 364 MathType@MTEF@5@5@+=feaafiart1ev1aaatCvAUfKttLearuWrP9MDH5MBPbIqV92AaeXatLxBI9gBaebbnrfifHhDYfgasaacH8akY=wiFfYdH8Gipec8Eeeu0xXdbba9frFj0=OqFfea0dXdd9vqai=hGuQ8kuc9pgc9s8qqaq=dirpe0xb9q8qiLsFr0=vr0=vr0dc8meaabaqaciaacaGaaeqabaqabeGadaaakeaadaWcaaqaaiabiodaZaqaaiabiAda2iabisda0aaaaaa@2FA0@. The algorithm can directly start in row k = 1 with the computation of Q1(6) instead of Q0(3) since a score of 3 cannot be achieved by the first prefix PSSM M0. Only score 4 of M0 contributes to Q2(10), scores 2 and 1 do not. In step d = 2, see (C), the algorithm computes Q2(9), starting in row k = 0. Pbuf2(9) is computed reusing the partial sum calculated in previous steps, such that Pbuf2(9) = 364 MathType@MTEF@5@5@+=feaafiart1ev1aaatCvAUfKttLearuWrP9MDH5MBPbIqV92AaeXatLxBI9gBaebbnrfifHhDYfgasaacH8akY=wiFfYdH8Gipec8Eeeu0xXdbba9frFj0=OqFfea0dXdd9vqai=hGuQ8kuc9pgc9s8qqaq=dirpe0xb9q8qiLsFr0=vr0=vr0dc8meaabaqaciaacaGaaeqabaqabeGadaaakeaadaWcaaqaaiabiodaZaqaaiabiAda2iabisda0aaaaaa@2FA0@ + Q1(7)·f(T) + Pbuf1(5)·f(A) = 564 MathType@MTEF@5@5@+=feaafiart1ev1aaatCvAUfKttLearuWrP9MDH5MBPbIqV92AaeXatLxBI9gBaebbnrfifHhDYfgasaacH8akY=wiFfYdH8Gipec8Eeeu0xXdbba9frFj0=OqFfea0dXdd9vqai=hGuQ8kuc9pgc9s8qqaq=dirpe0xb9q8qiLsFr0=vr0=vr0dc8meaabaqaciaacaGaaeqabaqabeGadaaakeaadaWcaaqaaiabiwda1aqaaiabiAda2iabisda0aaaaaa@2FA4@, and then copied to Q2(9). Pbuf1(4), Pbuf2(8), and Pbuf2(7) are filled based on Pbuf0(2), Q1(6), Pbuf1(5), and Q1(5) for further reuse. After step d = 2 the rest of the computation can be skipped since the cumulated probability Q2(11) + Q2(10) + Q2(9) = 532 MathType@MTEF@5@5@+=feaafiart1ev1aaatCvAUfKttLearuWrP9MDH5MBPbIqV92AaeXatLxBI9gBaebbnrfifHhDYfgasaacH8akY=wiFfYdH8Gipec8Eeeu0xXdbba9frFj0=OqFfea0dXdd9vqai=hGuQ8kuc9pgc9s8qqaq=dirpe0xb9q8qiLsFr0=vr0=vr0dc8meaabaqaciaacaGaaeqabaqabeGadaaakeaadaWcaaqaaiabiwda1aqaaiabiodaZiabikdaYaaaaaa@2F9A@ exceeds the given p-value π = 18 MathType@MTEF@5@5@+=feaafiart1ev1aaatCvAUfKttLearuWrP9MDH5MBPbIqV92AaeXatLxBI9gBaebbnrfifHhDYfgasaacH8akY=wiFfYdH8Gipec8Eeeu0xXdbba9frFj0=OqFfea0dXdd9vqai=hGuQ8kuc9pgc9s8qqaq=dirpe0xb9q8qiLsFr0=vr0=vr0dc8meaabaqaciaacaGaaeqabaqabeGadaaakeaadaWcaaqaaiabigdaXaqaaiabiIda4aaaaaa@2EAA@ and we obtain a score threshold of th = 10 corresponding to π.
Figure 14
Figure 14
Effect of alphabet reduction on the running time of ESAsearch. Experiment 6: Relative deviations of running time of ESAsearch when using reduced alphabets at different levels of stringency. We measured the relative percentage deviation with respect to the running time when using the standard 20 letter amino acid alphabet (= 0%). We searched with 11,411 PSSMs from the PRINTS database (Rel. 38) in the RCSB Protein Data Bank (PDB) with a total sequence length of 4.3 MB. In this example, the maximum performance improvement is achieved for an alphabet of size 4 and a p-value cutoff of π = 10-20.
Figure 15
Figure 15
Scaling behaviour of ESAsearch. Experiment 7: Scaling behavior of ESAsearch when searching with 576 TRANSFAC PSSMs on subsets of human chromosome 6 of different sizes and with different matrix similarity cutoff values (MSS). The subsets are prefixes of human chromosome 6 of length 2k for k = 0, 1, 2,..., 7.
Figure 16
Figure 16
Scaling behaviour of LAsearch. Experiment 7: Scaling behavior of LAsearch when searching with 576 TRANSFAC PSSMs on subsets of human chromosome 6 of different sizes and with different matrix similarity cutoff values (MSS). The subsets are prefixes of human chromosome 6 of length 2k for k = 0, 1, 2,..., 7.

References

    1. Gribskov M, McLachlan M, Eisenberg D. Profile Analysis: Detection of Distantly Related Proteins. Proc Nat Acad Sci USA. 1987;84:4355–4358. doi: 10.1073/pnas.84.13.4355. - DOI - PMC - PubMed
    1. Hulo N, Sigrist C, Le Saux V, Langendijk-Genevaux PS, Bordoli L, Gattiker A, De Castro E, Bucher P, Bairoch A. Recent improvements to the PROSITE database. Nud Acids Res. 2004;32:134–137. doi: 10.1093/nar/gkh044. - DOI - PMC - PubMed
    1. Attwood TK, Bradley P, Flower DR, Gaulton A, Maudling N, Mitchell AL, Moulton G, Nordle A, Paine K, Taylor P, Uddin A, Zygouri C. PRINTS and its automatic supplement, prePRINTS. Nucl Acids Res. 2003;31:400–402. doi: 10.1093/nar/gkg030. - DOI - PMC - PubMed
    1. Henikoff J, Greene E, Pietrokovski S, Henikoff S. Increased Coverage of Protein Families with the Blocks Database Servers. Nucl Acids Res. 2000;28:228–230. doi: 10.1093/nar/28.1.228. - DOI - PMC - PubMed
    1. Wu T, Nevill-Manning C, Brutlag D. Minimal-risk scoring matrices for sequence analysis. J Comp Biol. 1999;6:219–235. - PubMed

Publication types