. 2006 Sep;8(4):433-43.
doi: 10.2353/jmoldx.2006.060012.

Multiplex ligation-dependent probe amplification: a diagnostic tool for simultaneous identification of different genetic markers in glial tumors

Affiliations

Multiplex ligation-dependent probe amplification: a diagnostic tool for simultaneous identification of different genetic markers in glial tumors

Judith Jeuken et al. J Mol Diagn. 2006 Sep.

Abstract

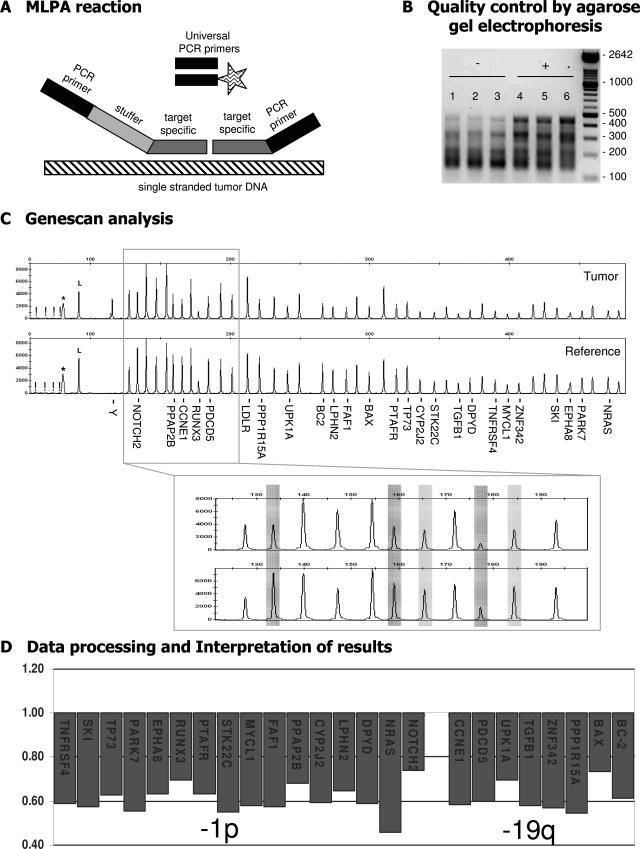
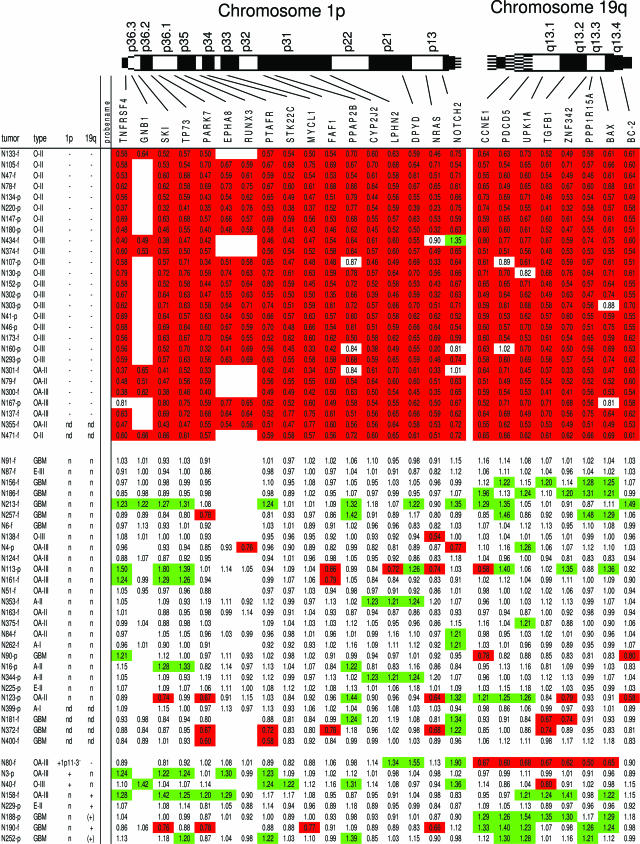
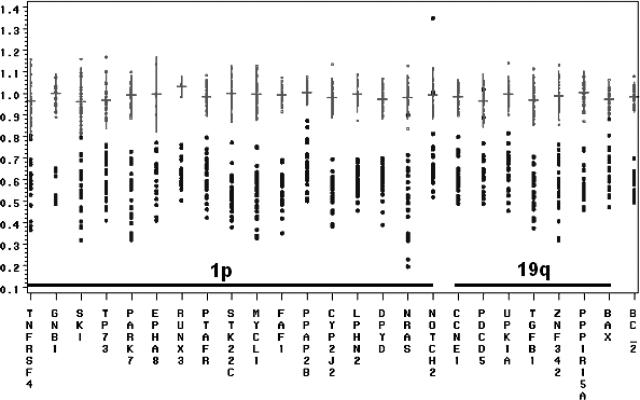
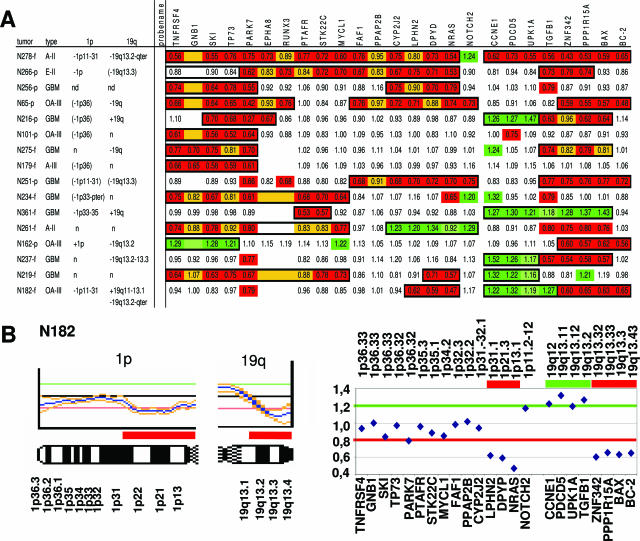
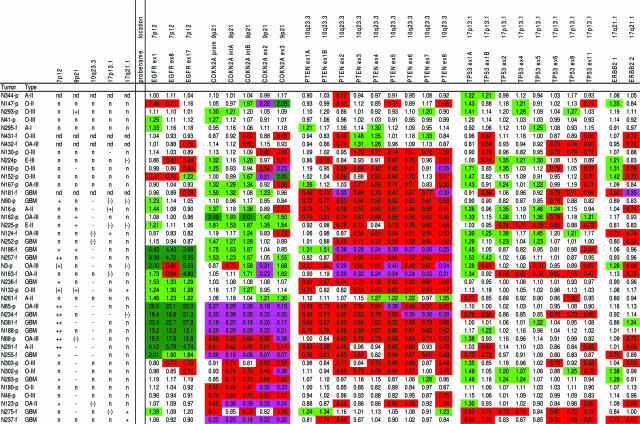
Genetic aberrations in tumors are predictive for chemosensitivity and survival. A test is needed that allows simultaneous detection of multiple changes and that is widely applicable in a routine diagnostic setting. Multiplex ligation-dependent probe amplification (MLPA) allows detection of DNA copy number changes of up to 45 loci in one relatively simple, semiquantitative polymerase chain reaction-based assay. To assess the applicability of MLPA, we performed MLPA analysis to detect relevant genetic markers in a spectrum of 88 gliomas. The vast majority of these tumors (n = 79) were previously characterized by comparative genomic hybridization. With MLPA kit P088 (78 cases), complete and partial loss of 1p and 19q were reliably identified, even in samples containing only 50% tumor DNA. Distinct 1p deletions exist with different clinically prognostic consequences, and in contrast to the commonly used diagnostic strategies (loss of heterozygosity or fluorescent in situ hybridization 1p36), P088 allows detection of such distinct 1p losses. Combining P088 with P105 will further increase the accurate prediction of clinical behavior because this kit identified markers (EGFR, PTEN, and CDKN2A) of high-grade malignancy in 41 cases analyzed. We conclude that MLPA is a reliable diagnostic tool for simultaneous identification of different region-specific genetic aberrations of tumors.


Figures

Figure 1
Figure 1
Schematic outline of the MLPA procedure. During MLPA analysis up to 45 target-specific probes are used in one reaction. A: The unique target-specific sequences (gray) of the probes are hybridized on single-stranded genomic DNA (hatched) after which the two adjacent parts of the probe are joined through ligation and PCR amplification is performed with a fluorescently (FAM) labeled primer (indicated by the asterisk). Because identical PCR primers (black) are used for all probes, there are no primer-specific advantages in this procedure. Each probe has a unique length [attributable to variation in the length of the stuffer sequence (light gray)], and therefore gel electrophoresis can be used to separate the individual probe fragments. B: Agarose gel electrophoresis is performed as an early (and extra) control step for identification of suboptimal MLPA reactions (P088 is shown as an example). DNA fragments are smaller than 500 bp. In suboptimal samples (−; lanes 1 to 3) the large DNA fragments are underrepresented compared to adequate experiments (+; lanes 4 to 6). C: Capillary electrophoresis is performed to identify and quantify the amplification products. Probe names are provided for those located on 1p and 19q. The MLPA mix includes an internal control for DNA quantity and quality. If these are insufficient, fragments of 64, 70, 76, and 82 bp will appear (indicated by an exclamation mark in C) whereas a band of 94 bp indicates successful ligation and hybridization (indicated by an L in C). A nonspecific broad peak can be present, with the size depending on the electrophoresis apparatus and fluorescence used (indicated by an asterisk in C). In this example, MLPA analysis with kit P088 of an oligodendroglial tumor (N293) with −1p/−19q (as detected by CGH) is shown. Subsequently, ratio analysis is performed, and results are visualized showing the probes in their chromosomal order (described in Materials and Methods; threshold used for losses and gains set at 0.8 and 1.2, respectively).
Figure 2
Figure 2
Overview of the results of MLPA analysis of gliomas using kit P088 for detection of losses on chromosome 1p and 19q. In the top row the probe names analyzed are listed in chromosomal order. Red boxes represent ratios surpassing the threshold set to detect a loss (0.8), whereas green boxes show a ratio greater than 1.2. White boxes without a ratio are present as during our study 2 probes in kit P088 were replaced by others (EPHA8 and RUNX3 were only present in lot 0408). The left column contains tumor identification numbers (-f and -p: tumor DNA from snap-frozen or paraffin-embedded tissue, respectively). Tumors are grouped based on the CGH results, containing a complete loss of 1p and 19q, no losses or gains on 1p or 19q, or gains involving 1p and 19q, respectively. Tumors containing partial deletions are shown in Figure 4. In the next column the histopathological diagnosis is given (for abbreviations see Materials and Methods) followed by columns with the results of previous CGH analysis with regard to chromosome 1p and 19q (n, no aberration detected; −, loss of chromosome arm; +, gain of chromosome arm; nd, not done; (), CGH ratio clearly deviating from the normal ratio but not crossing the threshold that was set to detect a loss (0.8) or gain (1.2) by CGH).
Figure 3
Figure 3
Overview of the distribution of individual probe ratios in control and −1p/−19q-containing samples. The x axis shows probe names in chromosomal order whereas the y axis shows ratios. Probe ratios for the reference DNAs are shown in gray, and ratios in tumors with a complete loss of 1p and 19q as detected by CGH are shown in black. For reference DNA, horizontal lines represent mean probe values; vertical lines represent mean values ± 2 times SD; dot represents individual probe ratio. The increased variation in probe ratios among the −1p/−19q tumors compared to the control samples is caused by the fact that the amount of tumor cells within a tumor sample directly affecting the probe ratios varies among the different tumors. Mean probe ratios and standard deviations were therefore not calculated for tumor DNA.
Figure 4
Figure 4
Overview of the detection of partial 1p and 19q losses using MLPA kit P088. A: Partial deletions as detected by MLPA kit P088. Legends are as described for Figure 2. Partial deletions as detected by CGH are listed on the left. Red and green boxes represent probe ratios <0.8 and >1.2. Additionally, yellow and light green boxes represent regions that, based on the relative low/high ratios and ratios of adjacent probes, were considered to be lost or gained even though the threshold (0.8 and 1.2) was not reached. The total deleted or gained regions as detected by this method are boxed in black. B: An example of comparison of conventional CGH analysis (left) and MLPA analysis using kit P088 (right) both identifying a partial deletion on 1p and 19q (case N182). The partial deletions detected in case N182 by CGH involve 1p11-31 and 19q13.2-qter, whereas MLPA detects a loss on 1p from NRAS (1p13.1) to LPHN2 (1p31.1) and a loss on 19q from ZNF342 (19q13.32) to BC2 (19q13.43); in addition, MLPA analysis shows a partial gain on 19q, and this gain is also indicated by CGH, but here the threshold is not crossed.
Figure 5
Figure 5
Results of MLPA analysis of gliomas using kit P105 (for EGFR, CDKN2A, PTEN, TP53, and ERBB2). See also legend in Figure 2. The probe names (gene name and exon analyzed are indicated) are listed; probe CDKN2A prom is located in the promotor region, CDKN2A intA is located 0.5 kb before the start of p14ARF exon 1, CDKN2A intB is located between p16 exon 1 and p14 exon 1, whereas ERBB2 1 and ERBB2 2 represent the 142-bp and 409-bp fragment of ERBB2 2, respectively (exact location not provided). CGH results are provided for chromosomal regions on which the genes are located [7p12 (EGFR), 9p21 (CDKN2A), 10q23.3 (PTEN), 17p13.1 (TP53) and 17q21.1 (ERBB2)]. Abbreviations used for CGH imbalances are as in Figure 2; the following symbols are also used: −, CGH ratio of ∼0.6 suggesting the presence of a homozygous deletion, ++, high copy amplification as indicated by a CGH ratio greater than 1.4. Red and green boxes represent probe ratios less than 0.8 and more than 1.2. Additionally, dark green boxes represent MLPA ratios more than 2.0 indicating high copy number amplifications, whereas pink boxes represent ratios less than 0.4, which may indicate homozygous deletions.

References

    1. Cairncross JG, Ueki K, Zlatescu MC, Lisle DK, Finkelstein D, Hammond RR, Silver JS, Stark PC, Macdonald DR, Ino Y, Ramsay DA, Louis DN. Specific genetic predictors of chemotherapeutic response and survival in patients with anaplastic oligodendrogliomas. J Natl Cancer Inst. 1998;90:1473–1479. - PubMed
    1. Schmid JS, Perry A, Borell TJ, Lee HK, O’Fallon J, Hosek SM, Kimmel D, Yates A, Burger PC, Scheithauer BW, Jenkins RB. Alterations of chromosome arms 1p and 19q as predictors of survival in oligodendrogliomas, astrocytomas, and mixed oligoastrocytomas. J Clin Oncol. 2000;18:636–645. - PubMed
    1. Cairncross JG. Aggressive oligodendroglioma: a chemosensitive tumor. Recent Results Cancer Res. 1994;135:127–133. - PubMed
    1. Kyritsis AP, Yung WKA, Bruner J, Gealson M, Levin VA. The treatment of anaplastic oligodendrogliomas and mixed gliomas. Neurosurgery. 1993;32:365–371. - PubMed
    1. Nutt CL, Mani DR, Betensky RA, Tamayo P, Cairncross JG, Ladd C, Pohl U, Hartmann C, McLaughlin ME, Batchelor TT, Black PM, von Deimling A, Pomeroy SL, Golub TR, Louis DN. Gene expression-based classification of malignant gliomas correlates better with survival than histological classification. Cancer Res. 2003;63:1602–1607. - PubMed

Publication types