. 2006 Dec 15;108(13):4086-93.
doi: 10.1182/blood-2006-05-025338. Epub 2006 Aug 24.

BCR ubiquitination controls BCR-mediated antigen processing and presentation

Affiliations

BCR ubiquitination controls BCR-mediated antigen processing and presentation

Lisa Drake et al. Blood. .

Abstract

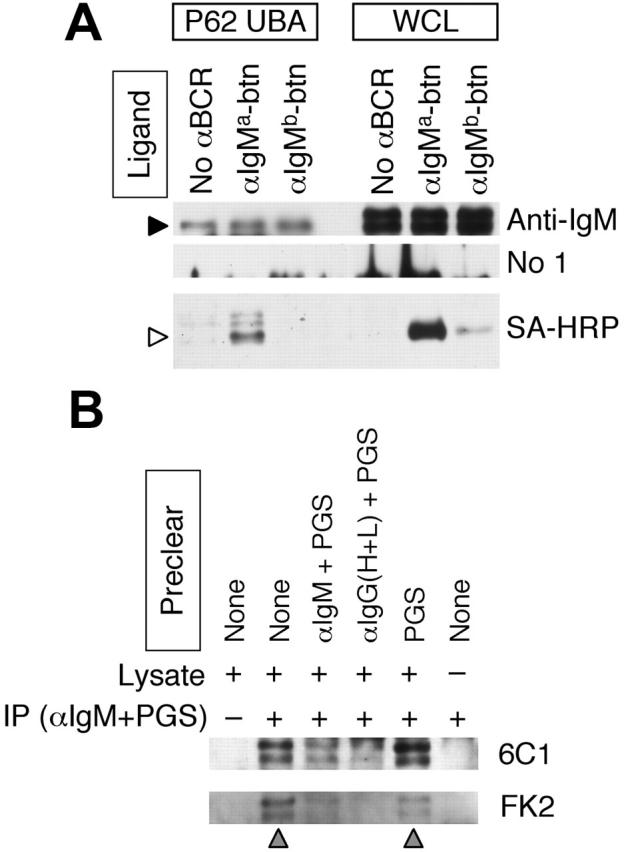
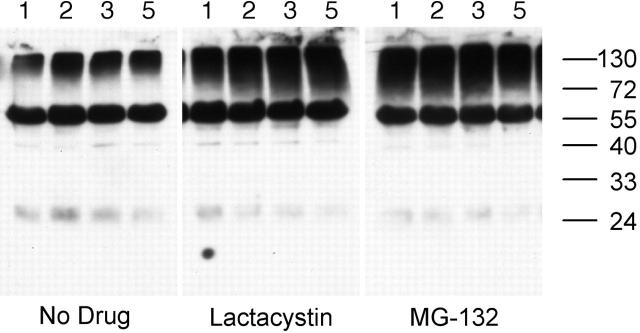
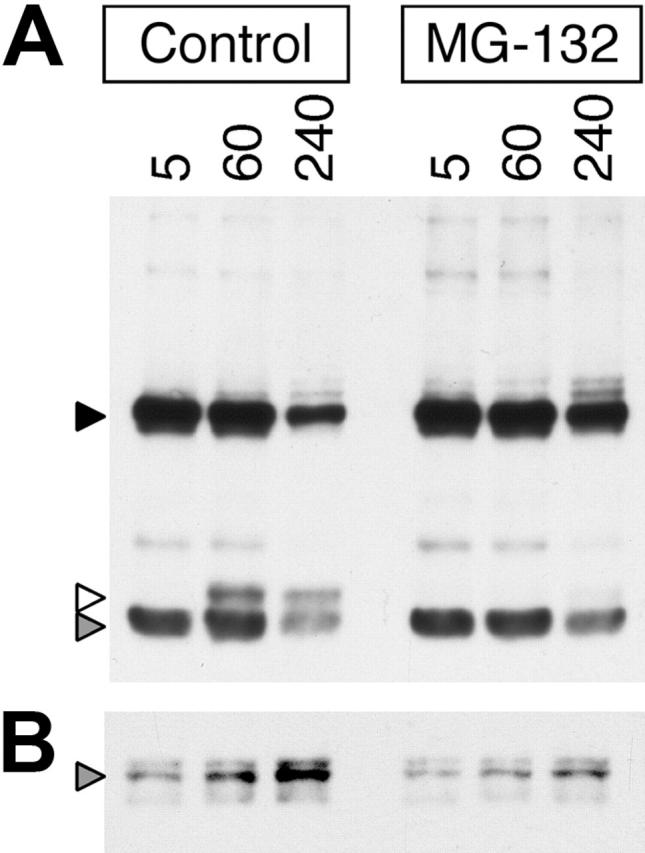
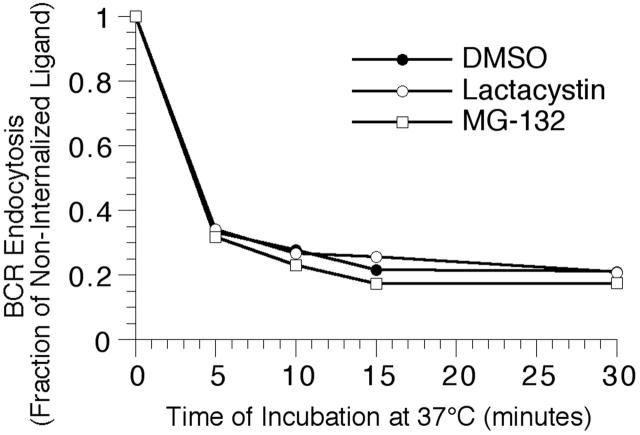
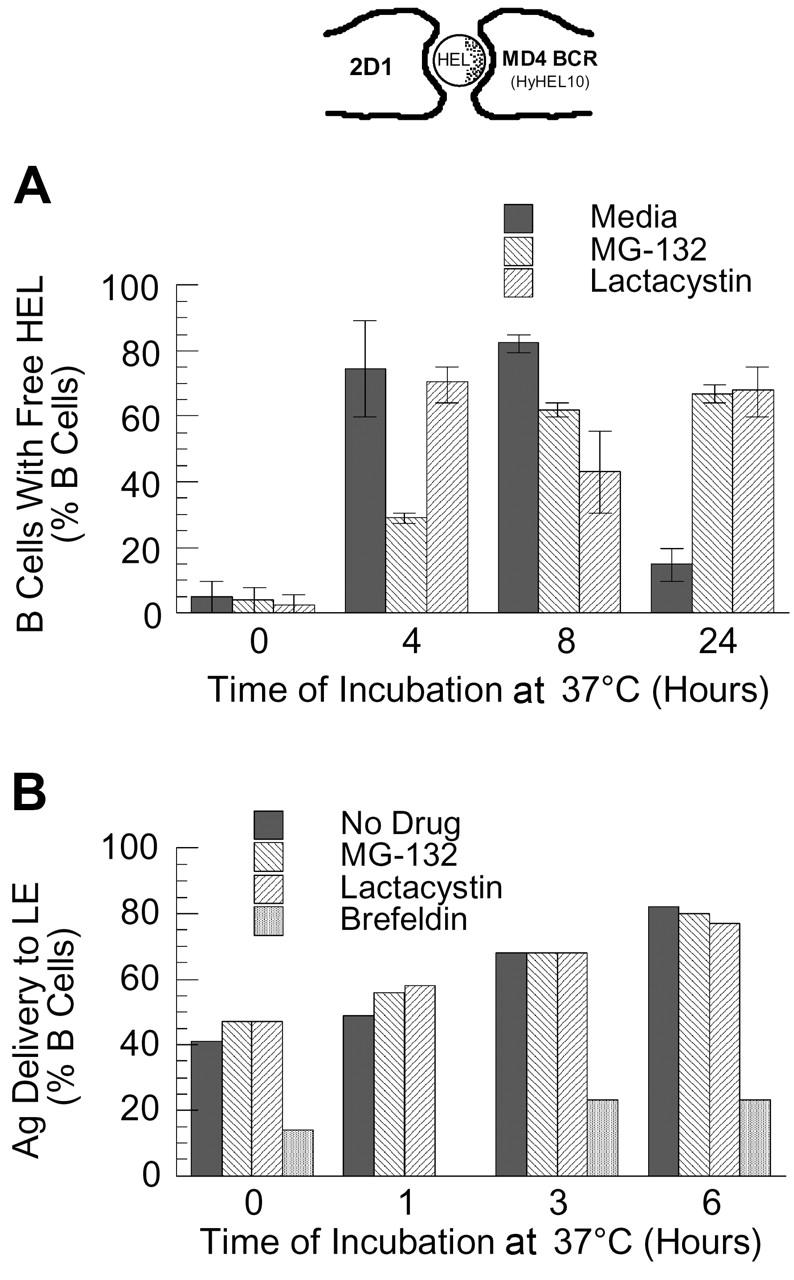
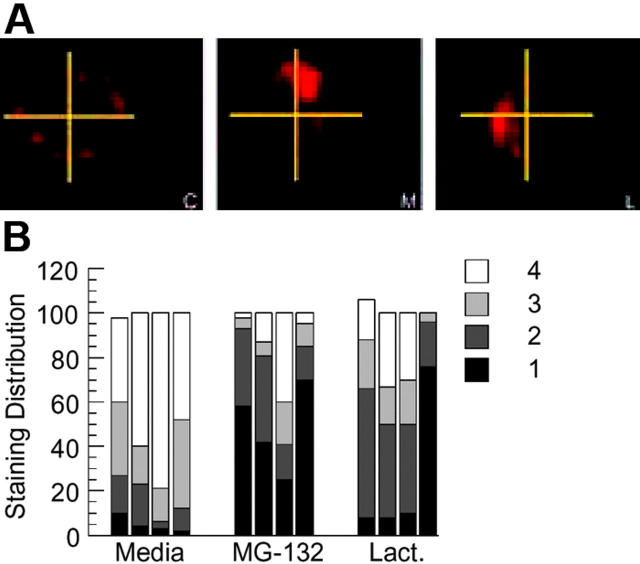
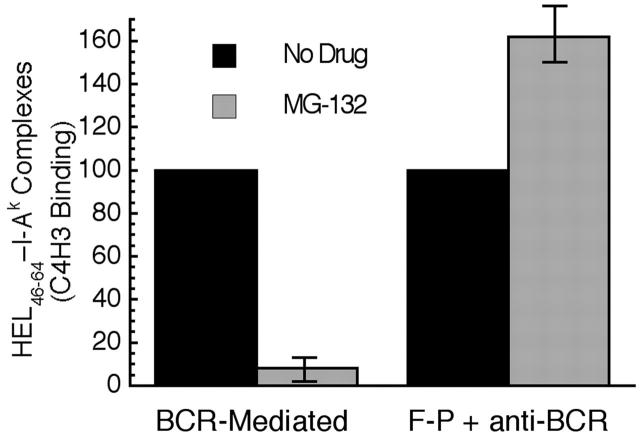
BCR-mediated antigen processing occurs at immunologically relevant antigen concentrations and hinges on the trafficking of antigen-BCR (Ag-BCR) complexes to class II-containing multivesicular bodies (MVBs) termed MIICs. However, the molecular mechanism underlying the trafficking of Ag-BCR complexes to and within MIICs is not well understood. In contrast, the trafficking of the epidermal growth factor receptor (EGFR) to and within MVBs occurs via a well-characterized ubiquitin-dependent mechanism, which is blocked by acute inhibition of proteasome activity. Using a highly characterized antigen-specific model system, it was determined that the immunoglobulin heavy chain subunit of the IgM BCR of normal (ie, nontransformed) B cells is ubiquitinated. Moreover, acute inhibition of proteasome activity delays the formation of ubiquitinated ligand-BCR complexes, alters the intracellular trafficking of internalized Ag-BCR complexes, and selectively blocks the BCR-mediated processing and presentation of cognate antigen, without inhibiting the endocytosis, processing, and presentation of non-cognate antigen internalized by fluidphase endocytosis. These results demonstrate that the trafficking of Ag-BCR complexes to and within MVB-like antigen processing compartments occurs via a molecular mechanism with similarities to that used by the EGFR, and establishes the EGFR as a paradigm for the further analysis of Ag-BCR trafficking to and within MIICs.


Figures

Figure 1.
Figure 1.
The immunoglobulin heavy chain of the IgM BCR is ubiquitinated. (A) MD4.B10.Br B cells (expressing an IgMa BCR) were incubated with either no antibody, anti–IgMa-btn, or anti–IgMb-btn as indicated. Cells were then lysed and ubiquitinated proteins precipitated with p62 UBA–agarose. Ubiquitinated p62 UBA–binding proteins (P62 UBA) as well as whole-cell lysates (WCLs) were analyzed by reducing SDS-PAGE and Western blotting. Anti-IgM indicates goat anti–murine IgM plus rabbit anti–goat IgG–HRP (to detect BCR IgM heavy chain); No 1°, rabbit anti–goat IgG–HRP only (negative control); and SA-HRP, streptavidin-HRP (to detect biotinylated anti-BCR antibody). The anti-IgM and No 1° blots were treated identically except for the omission of the primary antibody. The molecular weights of the 2 bands in the WCLs are 70 and 80 kDa. The filled arrowhead indicates the 70-kDa BCR IgM heavy chain protein of the endogenous BCR detected in the p62 UBA precipitates. The open arrowhead indicates the position of the heavy chain of the anti–IgMa-btn antibody. Shown are representative results from 1 of 3 independent experiments. (B) Splenocytes were lysed in RIPA buffer and the lysates precleared as indicated (αIgM + PGS indicates goat anti–murine IgM plus PGS; αIgG(H+L) + PGS, goat anti–murine IgG (H+L) plus PGS). The murine IgM BCR was then immunoprecipitated from the cleared lysates as indicated (+ indicates goat anti–murine IgM and PGS; –, PGS only). Immunoprecipitates were probed for the presence of ubiquitinated IgM by reducing SDS-PAGE and Western blotting with antiubiquitin mAbs (either the 6C1 or FK2, as indicated). The gray arrowheads below the blot indicate the lanes in which the IgM BCR was not precleared. The molecular masses of the 2 bands in the blots are 70 and 80 kDa. Shown are representative results from 1 of 3 independent experiments.
Figure 2.
Figure 2.
Proteasome inhibition results in the accumulation of ubiquitinated proteins in splenic B cells. MD4.B10.Br splenocytes were incubated at 37°C for 1, 2, 3, or 5 hours (as indicated above each lane) in media containing either no drug, 10 μM MG-132, or 10 μM lactacystin. The presence of ubiquitinated proteins in the cell lysates was determined by reducing SDS-PAGE and Western blotting with the 6C1 antiubiquitin mAb. The faint band at approximately 24 kDa is the light chain of the endogenous BCR, as it was detected in blots probed with secondary antibody alone (not shown). The prominent band of approximately 60-kDa molecular weight is a constitutively ubiquitinated protein (as opposed to detection of the endogenous BCR), as this band was not observed in blots probed with secondary antibody only. Similar results were obtained whether or not the B cells had been stimulated via the BCR (data not shown). Shown are representative results from 1 of 3 independent experiments.
Figure 3.
Figure 3.
Proteasome inhibition slows the degradation of BCR-associated ligand and delays the increased formation of ubiquitinated ligand–BCR complexes. (A) MD4.B10.Br splenocytes were pretreated for 1 hour at 37°C with or without 10 μM MG-132 as indicated. The cells were then pulsed with 10 μg/mL anti–IgMa-btn for the indicated time (minutes) at 37°C in the continued presence of inhibitor. The ligand-pulsed cells were then washed and lysed, and the lysates cleared by centrifugation. The proteolytic degradation of the BCR-internalized anti–IgMa-btn mAb in the whole-cell lysate was analyzed by reducing SDS-PAGE and Western blotting with SA-HRP (upper panel, ligand). The high-molecular-weight band (55 kDa, black arrowhead) represents the intact heavy chain of the anti–IgMa-btn mAb. The prominent low-molecular-weight band (25 kDa, gray arrowhead) represents the intact light chain of the anti–IgMa-btn mAb. The band of 30-kDa molecular weight (white arrowhead) is a proteolytic fragment of the heavy chain of the anti–IgMa-btn mAb. Shown are representative results from 1 of 5 independent experiments. (B) A portion of the lysates analyzed in panel A was analyzed for the presence of anti–IgMa-btn–BCR-ubiquitin complexes by precipitation of ubiquitinated proteins (including ubiquitinated ligand–BCR complexes) with p62 UBA–agarose and analysis of the samples by reducing SDS-PAGE and Western blotting with SA-HRP. The gray arrowhead marks the position of intact 55-kDa heavy chain of the anti–IgMa-btn mAb, bound to the ubiquitinated BCR and thus precipitated by the p62 UBA–agarose. Shown are representative results from 1 of 3 independent experiments.
Figure 4.
Figure 4.
Proteasome inhibition fails to alter the kinetics of BCR-mediated antigen internalization. Splenic B cells were pretreated with the indicated proteasome inhibitor for 1 hour at 37°C, before analyzing the BCR-mediated internalization of bound ligand by flow cytometry, as described in “Materials and methods.” The results demonstrate that inhibition of proteasome activity fails to alter the kinetics of BCR-mediated antigen internalization, even though the treatment resulted in the accumulation of high-molecular-mass ubiquitinated proteins (Figure 2). Shown are representative results from 1 of 4 independent experiments (4 investigating the effect of MG-132 on BCR internalization, and 2 analyzing the effect of lactacystin treatment on BCR internalization).
Figure 5.
Figure 5.
Proteasome inhibition delays the dissociation of internalized antigen-BCR complexes. (A) MD4.B10.Br splenocytes were pretreated with proteasome inhibitor and pulsed with antigen as described in “Materials and methods.” The cells were then fixed and stained for BCR-dissociated antigen, using the HyHEL10 monoclonal antibody that recognizes the same HEL epitope as the MD4 BCR (see image at the top of the figure and Gondré-Lewis et al11). The cells were then analyzed by fluorescence microscopy, and the percent of B cells containing detectable BCR-dissociated antigen was determined. The results demonstrate that while BCR-dissociated antigen is readily detectable 4 hours after internalization under all conditions, BCR-dissociated antigen is present for a prolonged period of time in proteasome-inhibited B cells. Shown are average values from 2 independent experiments (bars). The error bars indicate the range of values obtained across both experiments. (B) B10.Br splenocytes were treated as indicated (no drug or 10 μM MG-132, lactacystin, or brefeldin A), and then allowed to internalize HEL by fluid-phase endocytosis for 30 minutes. The cells were then washed, chased for the indicated times, fixed, and stained for HEL and the LE/L marker LAMP. The percent of B cells in which HEL was detectable within LAMP+ LE/L is shown. The results demonstrate that unlike treatment with brefeldin A (which is known to inhibit trafficking between the earlier and later aspects of the endocytic pathway), treatment of the cells with the proteasome inhibitor fails to slow the delivery of fluid-phase markers to the later aspects of the endocytic pathway. It should be noted that at the 6-hour time point, the B cells contained low overall levels of detectable HEL. Shown are representative results from 1 of 3 independent experiments.
Figure 6.
Figure 6.
Proteasome inhibition alters the intracellular distribution of persisting antigen-BCR complexes. (A) MD4.B10.Br splenocytes were pretreated with the indicated inhibitor for 1 hour at 37°C before pulsing with antigen (100 nM HEL) for 4 hours. The cells were then washed (to remove both antigen and drug) and cultured for an additional 18 to 20 hours at 37°C. The cells were then collected, fixed, and stained for persisting Ag-BCR complexes using the 2D1 anti-HEL mAb., C indicates control, non–drug-treated cells; M, MG-132–treated cells; and L, lactacystin-treated cells. Shown are representative images from 1 of 4 independent experiments. (B) For each experimental condition, 100 B cells were visualized and the distribution of persisting antigen was scored as described in “Material and methods.” Shown is the frequency of cells in which the persisting Ag-BCR complexes were detected in 1, 2, 3, or 4 quadrants of the cell. Each bar represents the results from a single independent experiment.
Figure 7.
Figure 7.
Acute proteasome inhibition selectively inhibits BCR-mediated antigen processing and presentation. B cells were pretreated with the indicated drug for 1 hour at 37°C. The cells were then pulsed with antigen (BCR indicates MD4.B10.Br pulsed with 100 nM HEL; F-P, B10.Br pulsed with 100 μM HEL and 100 nM anti–murine IgM antibody) for 4 hours in the continued presence of drug before washing and an additional 18 to 20 hours of incubation at 37°C in the absence of drug or antigen. The cells were then harvested and the level of HEL46-61–I-Ak complexes expressed on the surface of the cell was determined by staining with the HEL46-61–I-Ak complex–specific mAb C4H3 and subsequent analysis by flow cytometry.,, Experiments performed with lactacystin gave similar results to those obtained with MG-132. However, this treatment resulted in a significantly greater level of B-cell death, presumably due to the irreversible nature of the inhibitor (data not shown). Parallel analysis of each sample for the expression of total I-Ak class II molecules (by staining with the panreactive mAb 11-5.2) revealed that none of the drug treatments resulted in a significant (ie, > 10%) decrease in the level of total I-Ak molecules expressed by the cells. Consistent with previous reports that HEL46-61 is presented exclusively on newly synthesized I-Ak molecules,, treatment with either 10 μM puromycin or 10 μg/mL brefeldin A inhibited C4H3 binding by 80% to 90% under all conditions. The bars indicate the average level of HEL46-61–I-Ak complexes expressed under the indicated conditions, as a percent of the level observed in non–drug-treated cells. The error bars indicate the range of experimental values obtained under each condition. Shown are from results from 2 independent experiments.

References

    1. Trombetta ES, Mellman I. Cell biology of antigen processing in vitro and in vivo. Annu Rev Immunol. 2005;23: 975-1028. - PubMed
    1. Kleijmeer MJ, Raposo G, Geuze HJ. Characterization of MHC class II compartments by immunoelectron microscopy. Methods. 1996;10: 191-207. - PubMed
    1. Watts C. The exogenous pathway for antigen presentation on major histocompatibility complex class II and CD1 molecules. Nat Immunol. 2004; 5: 685-692. - PubMed
    1. Watts C, Reid PA, West MA, Davidson HW. The antigen processing pathway in B lymphocytes. Semin Immunol. 1990;2: 247-253. - PubMed
    1. Nashar TO, Drake JR. The pathway of antigen uptake and processing dictates MHC class II-mediated B cell survival and activation. J Immunol. 2005;174: 1306-1316. - PubMed

Publication types

MeSH terms