. 2006 Aug 25;313(5790):1137-40.
doi: 10.1126/science.1128294.

Chemical chaperones reduce ER stress and restore glucose homeostasis in a mouse model of type 2 diabetes

Affiliations

Chemical chaperones reduce ER stress and restore glucose homeostasis in a mouse model of type 2 diabetes

Umut Ozcan et al. Science. .

Abstract

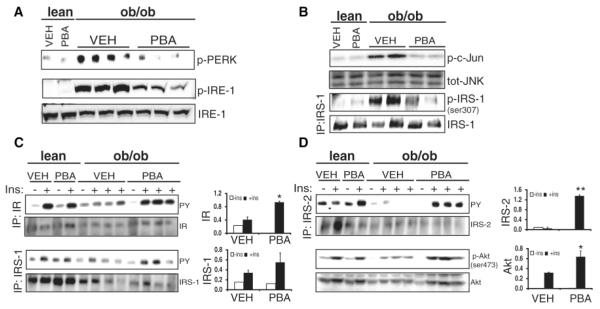
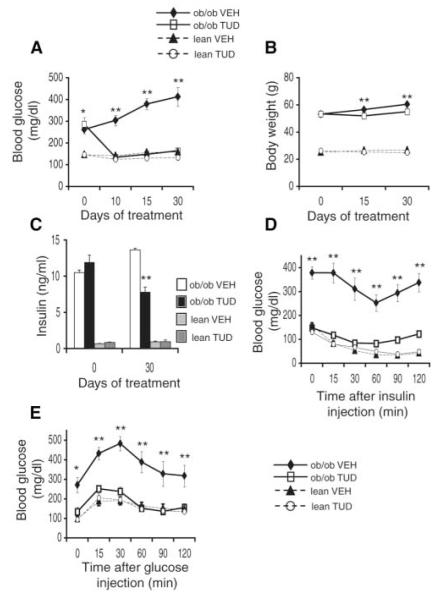
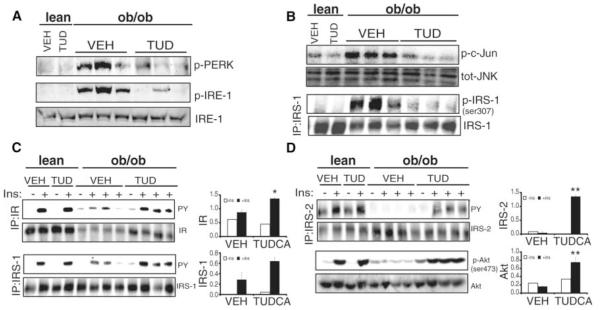
Endoplasmic reticulum (ER) stress is a key link between obesity, insulin resistance, and type 2 diabetes. Here, we provide evidence that this mechanistic link can be exploited for therapeutic purposes with orally active chemical chaperones. 4-Phenyl butyric acid and taurine-conjugated ursodeoxycholic acid alleviated ER stress in cells and whole animals. Treatment of obese and diabetic mice with these compounds resulted in normalization of hyperglycemia, restoration of systemic insulin sensitivity, resolution of fatty liver disease, and enhancement of insulin action in liver, muscle, and adipose tissues. Our results demonstrate that chemical chaperones enhance the adaptive capacity of the ER and act as potent antidiabetic modalities with potential application in the treatment of type 2 diabetes.


Figures

Fig. 1
Fig. 1
Effect of PBA treatment on glucose metabolism and insulin sensitivity in ob/ob mice. PBA (1 g per kg of body weight) was orally administered to 7- to 8-week-old male ob/ob mice and age- and sex-matched WT controls (n ≥ 10 mice in each group) for 20 days. (A) Blood glucose concentrations (mg/dl) in vehicle- or PBA-treated ob/ob and WT mice at the fed state. (B) Body weights of ob/ob and WT mice treated with vehicle or PBA. (C) Plasma insulin concentrations (ng/ml) measured after a 6-hour fast at the onset of experiments and after 20 days of treatment with PBA or vehicle. (D) Glucose (0.5 g/kg) and (E) insulin (2 IU/kg) tolerance tests, performed after 15 and 28 days of vehicle or PBA treatment, respectively. Data are presented as the means ± SEM, and asterisks indicate statistical significance determined by student’s t test (*P < 0.05, **P < 0.001).
Fig. 2
Fig. 2
Effect of PBA treatment on markers of ER stress in the liver tissue of ob/ob mice. (A) Phosphorylation of PERK (Thr980) and IRE-1α in liver tissues of PBA- or vehicle-treated ob/ob mice and lean controls. (B) Liver tissue total JNK activity, JNK protein levels, serine phosphorylation of IRS-1 (Ser-307), and total JNK and IRS-1 protein levels in the same group of mice. (C) Insulin-stimulated insulin receptor (IR), insulin receptor substrate 1 (IRS-1), insulin receptor substrate 2 (IRS-2), and (D) Akt (Ser-473) phosphorylation in liver tissues of PBA- and vehicle-treated lean and ob/ob mice upon insulin (2 IU/kg) infusion through the portal vein. The graphs on the right of each blot show the quantitation of phosphorylation for each protein. Data are presented as the means ± SEM, and asterisks indicate statistical significance determined by student’s t test (*P < 0.05, **P < 0.001).
Fig. 3
Fig. 3
Effect of TUDCA treatment on systemic glucose metabolism and insulin sensitivity in ob/ob mice. (A) Blood glucose concentrations (mg/dl) in the fed state in ob/ob and WT mice, treated with TUDCA or vehicle. (B) Body weights of ob/ob and WT mice treated with TUDCA or vehicle. (C) Plasma insulin concentrations (ng/ml) measured after a 6-hour fast at the onset of experiments and after 30 days of treatment with TUDCA or vehicle. (D) Insulin (2 IU/kg) tolerance and (E) glucose (0.5 g/kg) tolerance tests performed after 15 days of treatment with TUDCA or vehicle. The insulin and glucose tolerance tests were performed on different groups of mice. Data are presented as the means ± SEM, and asterisks indicate statistical significance determined by Student’s t test (*P < 0.05, **P < 0.001).
Fig. 4
Fig. 4
Effect of TUDCA treatment on ER stress parameters, JNK activation, and insulin receptor signal transduction pathway in the liver of ob/ob mice. (A) PERK (Thr-980) and IRE-1α phosphorylation, and total IRE-1α levels in liver tissues of TUDCA- or vehicle-treated ob/ob mice and lean controls. (B) JNK activity and IRS-1 (Ser-307) phosphorylation in liver tissues of ob/ob mice after TUDCA administration. (C) Insulin-stimulated tyrosine phosphorylation of insulin receptor and IRS-1. (D) Insulin-stimulated IRS-2 tyrosine, and Akt serine (Ser-473) phosphorylation in the liver tissues of TUDCA- and vehicle-treated ob/ob mice and lean WT controls. The graphs on the right of each blot demonstrate the quantitation of phosphorylation of each molecule. Data are presented as the means ± SEM, and asterisks indicate statistical significance determined by student’s t test (*P < 0.05, **P < 0.001).
Fig. 5
Fig. 5
Hyperinsulinemic-euglycemic clamp studies in ob/ob mice treated with PBA or TUDCA. Hyperinsulinemic-euglycemic clamp studies were performed after 20 days of treatment with vehicle, PBA, or TUDCA. (A) Basal hepatic glucose production (HGP). (B) HGP during the clamp. (C) Glucose infusion rates (GIR). (D) Glucose disposal rates (Rd). (E) Glucose uptake into muscle tissue during the clamp. (F) Glucose uptake into white adipose tissue (WAT). (G) Glucose levels during clamp procedure. (H) Glucose infusion rates during the clamp procedure. Data are presented as the means ± SEM, and asterisks indicate statistical significance determined by analysis of variance, post hoc test–Fisher’s Protected Least Significant Difference (*P < 0.05, **P < 0.001).

References

    1. Permutt MA, Wasson J, Cox N. J. Clin. Invest. 2005;115:1431. - PMC - PubMed
    1. Wellen KE, Hotamisligil GS. J. Clin. Invest. 2005;115:1111. - PMC - PubMed
    1. Ozcan U, et al. Science. 2004;306:457. - PubMed
    1. Ozawa K, et al. Diabetes. 2005;54:657. - PubMed
    1. Nakatani Y, et al. J. Biol. Chem. 2005;280:847. - PubMed

Publication types

MeSH terms