. 2007 Jan;36(1):122-30.
doi: 10.1165/rcmb.2006-0036OC. Epub 2006 Aug 24.

Contractility and Ca2+ signaling of smooth muscle cells in different generations of mouse airways

Affiliations

Contractility and Ca2+ signaling of smooth muscle cells in different generations of mouse airways

Yan Bai et al. Am J Respir Cell Mol Biol. 2007 Jan.

Abstract

The control and mechanisms of airway smooth muscle cell (SMC) contraction were investigated with a sequential series of lung slices from different generations of the same airway from the cardiac lobe of the mouse lung. Airway contraction was measured by monitoring the changes in airway lumen area with phase-contrast microscopy. Changes in intracellular calcium concentration of the SMCs were studied with a custom-built confocal or two-photon microscope. The distribution of the airway SMCs and the muscarinic M(3) or 5-HT(2A) receptors was determined with immunofluorescence. Methacholine and 5-HT induced a concentration-dependent airway contraction and Ca(2+) oscillations within the SMCs of each airway generation. The airway contraction in response to the same agonist concentration was greater in the middle generation compared with the distal or proximal generations of the same airway. Similarly, the Ca(2+) oscillations varied in different generations of the same airway, with a slower frequency in the SMCs of the distal zone as compared with the middle or proximal zones of airways. By contrast, high KCl induced minimal contraction and very slow Ca(2+) oscillations throughout the whole intrapulmonary airway. The slower agonist-induced Ca(2+) oscillations in the distal zone correlated with a reduced expression of agonist receptors. The layer of SMCs increased in thickness in the middle and proximal zones. These results indicate that the contractility of airway SMCs varies at different positions along the same airway and that this response partially results from different Ca(2+) signaling and the total amount of the SMCs.


Figures
<b>Figure 1.</b>
Figure 1.
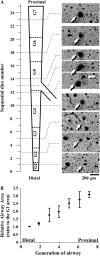
(A) A series of phase-contrast images of the serial lung slices documenting the change in size of a single intrapulmonary airway along its course from the periphery to the proximal zone of the cardiac lobe of a mouse lung. The position of the airway of interest within the slice is indicated by the white arrow. Slices shown were selected from a full sequential series of slices. The relative position of each slice is shown in relationship to the schematic drawing (left of the images) that represents the divergence of the airway from the distal section (first generation, G1) to the proximal section (seventh generation, G7) and by the numbers of slices collected from each generation of the airway. The fourth generation airway transitioned into the fifth generation after merging with another airway (indicated by horizontal arrow in the 12th slice). Representative images from at least eight series of sections of one intrapulmonary airway in the cardiac lobes of different mice. (B) The relative mean cross-sectional area of the intrapulmonary airway at various generations in the resting state. The relative area is expressed as a ratio of the area normalized to the area of the first-generation airway (area = 5,677.5 ± 115.3 μm2, corresponding to a diameter of 84.0 ± 1.1 μm, assuming a circular shape). From the distal zone (G1, area A1) to the proximal zone (G7, area A7), the lumen area of intrapulmonary airway increased three times (A7/A1 = 3.09 ± 0.19). Each point represents the mean ± SEM from eight different airways from different cardiac lobes of eight mice.
<b>Figure 2.</b>
Figure 2.
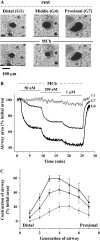
MCh-induced contractile responses at different generations of the same intrapulmonary airway. (A) A series of phase-contrast images showing the resting state and the maximal contracted state in response to 1 μM MCh in a distal (G1, first generation), middle (G4, fourth generation), and proximal zone (G7, seventh generation) of the same airway. (B) Representative traces demonstrating the contractile responses of the same airway SMCs at different generations (G1 [light grey line], G4 [black line], G7 [dark grey line]) to successive ascending concentrations of MCh. (C) A summary of the contractility of each generation of the intrapulmonary airway in response to 50 nM (light grey line and solid circles), 200 nM (dark grey line and solid squares) and 1 μM (black line and solid triangles) MCh. Contraction was calculated after 5 min of agonist exposure. Each point represents the mean ± SEM from at least five different airways.
<b>Figure 3.</b>
Figure 3.
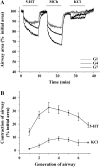
The contractile response, induced by 5-HT and KCl, of an intrapulmonary airway at different zones. (A) Representative traces demonstrating the contractile responses of the airway at G1 (light grey line), G4 (dark grey line), and G7 (black line) to a sequential exposure of 100 nM 5-HT, 200 nM MCh, and 50 mM KCl. (B) A summary of the lumen contraction at each airway generation in response to 100 nM 5-HT and 50 mM KCl. Contraction was calculated after 5 min of agonist or KCl exposure. Each point represents the mean ± SEM from five to eight different airways.
<b>Figure 4.</b>
Figure 4.
The Ca2+ signaling induced by MCh in airway SMCs from different zones of intrapulmonary airways. (A) A representative trace of the intracellular Ca2+ signaling of SMCs located within the fourth generation in response to 200 nM MCh. (B) The MCh (50 nM, 200 nM, 1 μM) induced Ca2+ signaling of SMCs from distal (G1), middle (G4) and proximal (G7) zones of the airways. Ca2+ responses of the same SMC to different concentration of MCh were recorded after 5 min of agonist exposure. The slices were stimulated with ascending concentrations of MCh. In each generation, higher concentrations of MCh induced faster Ca2+ oscillations. However, the frequency of the Ca2+ oscillations of SMCs in G1 airways was slower than those in G4 or G7 airways in response to the same concentration of MCh. (C) The summary of the frequency of the Ca2+ oscillation induced by increasing concentrations of MCh at different generations of the airway. Each column represents the mean ± SEM from different SMCs from five slices of five different mice. *P < 0.05 compared with the frequency of Ca2+ oscillations induced by MCh (200 nM) at G4 or G7. #P < 0.05 compared with the frequency of Ca2+ oscillations induced by MCh (1 μM) at G4.
<b>Figure 5.</b>
Figure 5.
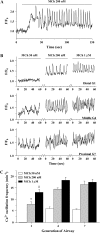
The Ca2+ signaling induced by 5-HT and KCl at different generations of the intrapulmonary airways. (A) The representative traces showing the Ca2+ signaling of SMCs induced by 100 nM 5-HT (after 5 min of exposure) or 50 mM K+ (after 4 min of exposure) at G1, G4, and G7. The recording time of response to 50 mM K+ was extended over 120 seconds due to the slow frequency of the Ca2+ oscillations. (C) The summary of the frequency of the Ca2+ oscillation induced by 100 nM 5-HT and 50 mM K+ at G1, G4, and G7. Each column represents the mean ± SEM from different SMCs from 5–10 airways of four different mice. *P < 0.05, comparing the frequency of the Ca2+ oscillations between G1 and G4 or G7.
<b>Figure 6.</b>
Figure 6.
Relationship between the Ca2+ oscillation frequency and airway contraction induced by MCh at different airway zones. Data from the concentration-response curve of the airway contraction (Figure 2C, change in airway area) were re-plotted with respect to the corresponding frequency of Ca2+ oscillations in response to various concentrations of MCh (Figure 4C). Greater contraction was observed at the same frequency of Ca2+ oscillations in the middle (G4) zone compared with the distal or proximal (G1 or G7) zones.
<b>Figure 7.</b>
Figure 7.
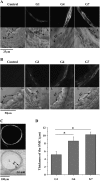
Assessment of the distribution of the muscarinic M3 and 5-HT2A receptors on SMCs and the thickness of the SMC layer by immunofluorescence. (A) Muscarinic M3 receptor or (B) 5-HT2A receptor staining from G1, G4, and G7 airways (upper panels). The control conditions substituted normal rabbit (control for M3 receptor) or mouse serum (control for 5-HT2A receptor) for specific antibodies. The corresponding nonconfocal, transmitted-light image for each fluorescence image is shown in the lower panel. EC, epithelial cells; L, Lumen. (C) The thickness of airway SMCs surrounding an airway was visualized by immunofluorescence of SMC α-actin (left, top) and transmitted-light (left, bottom). (D) A summary of the thickness of the SMC layer (equal to the thickness of fluorescence zone) at G1, G4, and G7. Each column represents mean ± SEM from at least five different airways from three mice. *P < 0.05, comparing the thickness of SMCs at G1 to that at G4 or G7.

References

    1. Global Initiative for Asthma. Global Strategy for asthma management and prevention. National Institute of Health 2002, NIH publication no. 02-3659.
    1. Hamid Q, Song Y, Kotsimbos TC, Minshall E, Bai TR, Hegele RG, Hogg JC. Inflammation of small airways in asthma. J Allergy Clin Immunol 1997;100:44–51. - PubMed
    1. Martin RJ. Therapeutic significance of distal airway inflammation in asthma. J Allergy Clin Immunol 2002;109:S447–S460. - PubMed
    1. Roche WR. Inflammatory and structural changes in the small airways in bronchial asthma. Am J Respir Crit Care Med 1998;157:S191–S194. - PubMed
    1. Yanai M, Sekizawa K, Ohrui T, Sasaki H, Takishima T. Site of airway obstruction in pulmonary disease: direct measurement of intrabronchial pressure. J Appl Physiol 1992;72:1016–1023. - PubMed

Publication types