. 2006 Sep 20;25(18):4338-49.
doi: 10.1038/sj.emboj.7601295. Epub 2006 Aug 24.

Systems analysis of effector caspase activation and its control by X-linked inhibitor of apoptosis protein

Affiliations

Systems analysis of effector caspase activation and its control by X-linked inhibitor of apoptosis protein

Markus Rehm et al. EMBO J. .

Abstract

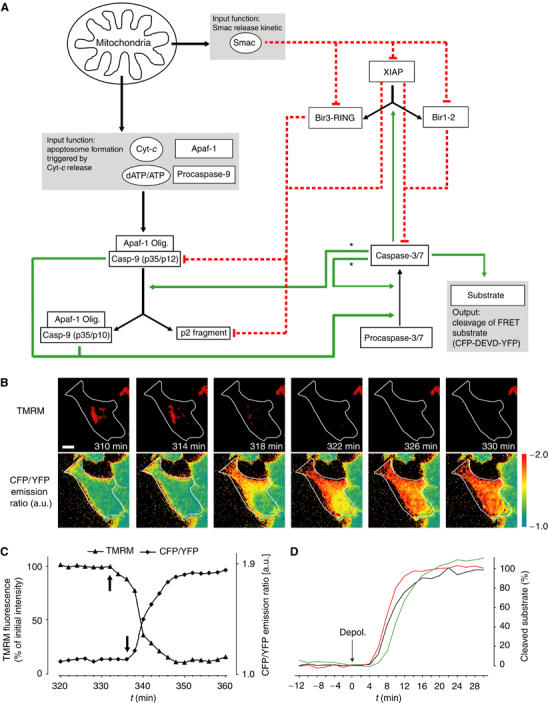
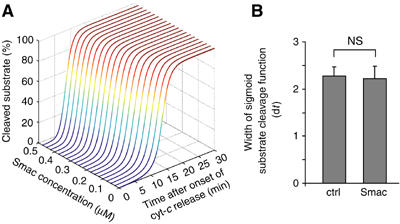
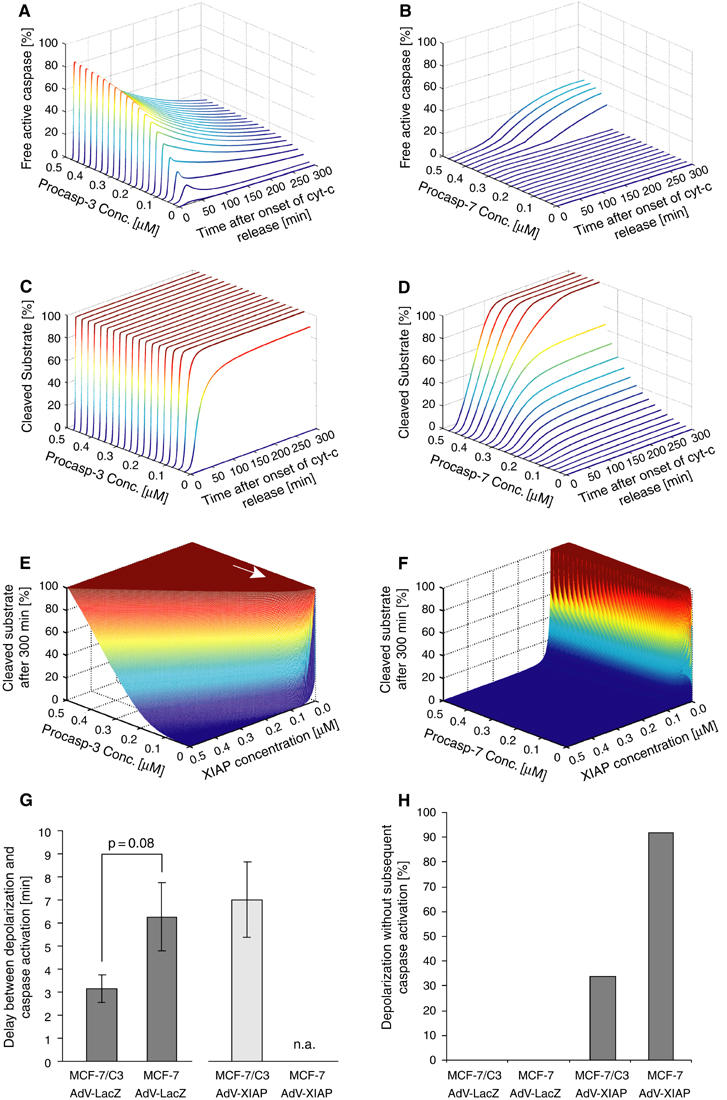
Activation of effector caspases is a final step during apoptosis. Single-cell imaging studies have demonstrated that this process may occur as a rapid, all-or-none response, triggering a complete substrate cleavage within 15 min. Based on biochemical data from HeLa cells, we have developed a computational model of apoptosome-dependent caspase activation that was sufficient to remodel the rapid kinetics of effector caspase activation observed in vivo. Sensitivity analyses predicted a critical role for caspase-3-dependent feedback signalling and the X-linked-inhibitor-of-apoptosis-protein (XIAP), but a less prominent role for the XIAP antagonist Smac. Single-cell experiments employing a caspase fluorescence resonance energy transfer substrate verified these model predictions qualitatively and quantitatively. XIAP was predicted to control this all-or-none response, with concentrations as high as 0.15 microM enabling, but concentrations >0.30 microM significantly blocking substrate cleavage. Overexpression of XIAP within these threshold concentrations produced cells showing slow effector caspase activation and submaximal substrate cleavage. Our study supports the hypothesis that high levels of XIAP control caspase activation and substrate cleavage, and may promote apoptosis resistance and sublethal caspase activation in vivo.


Figures

Figure 1
Figure 1
Modelled signalling network and cellular responses during apoptosome-dependent apoptosis. (A) Schematic representation of the modelled interaction network. Mitochondria undergo MOMP and concurrently depolarise. Following Apaf-1 oligomerisation and caspase-9 activation, effector caspases-3 and -7 get activated. Enzymatic cleavage processes are shown as green arrows; inhibitory interactions by XIAP and Smac proteins are shown as red dashed lines. Parameters in grey boxes serve as input and output functions of the computational model. Asterisks highlight reactions that are solely caspase-3 dependent. In addition, all proteins are subject to proteasomal degradation. (B) MOMP is followed by effector caspase activation. Images illustrate a representative HeLa cell infected with a β-galactosidase expression virus (AdV-LacZ; m.o.i. 100) and treated with 1 μM STS. Mitochondrial depolarisation is shown as a decrease in TMRM fluorescence. Cell boundaries are outlined in white. Time stamps show the time after stimulus addition. Effector caspase activation was detected by an increase in the CFP/YFP emission ratio because of proteolytical cleavage of a CFP-DEVD-YFP fusion protein (see Materials and methods). Probe cleavage in the cytosol precedes cleavage in nuclear regions. Scale bar=5 μm. (C) Microscopy images were quantitatively analysed. Mitochondrial depolarisation (TMRM intensity) and effector caspase-dependent FRET disruption (CFP/YFP emission ratio) data for a representative HeLa cell is shown as function of time after stimulus addition (1 μM STS). Arrows indicate onset of depolarisation and onset of substrate cleavage. (D) Analysis of substrate cleavage. Traces from three representative HeLa cells show that FRET substrate cleavage during STS-induced apoptosis is complete. Traces were synchronised to the time point of depolarisation.
Figure 2
Figure 2
Protein profiles during apoptosome-dependent apoptosis. (A) Modelled output signal for the cleavage of an effector caspase FRET substrate under standard conditions. This model output can directly be compared to the experimental output (Figure 1C). (B, C) Cyt-c release, apoptosome formation and Smac release as model inputs lead to activation of apoptosome-bound caspase-9 and free caspase-3 (caspase-3 that is not inhibited by XIAP or BIR1-2). All concentrations are shown in relative units normalised to their potential maximum. (D) The amounts of free and caspase-bound XIAP fractions are shown normalised to the initial XIAP concentration. (E) The free XIAP cleavage products BIR1-2 and BIR3-RING, and the fractions bound to caspases are shown normalised to the initial XIAP concentration. (F) Free and XIAP-associated Smac is shown over time normalised to the initial XIAP concentration. (G) Modelled effects of proteasome and caspase inhibition on the Smac concentration. Proteasome inhibition prevents Smac degradation whereas inhibition of caspases by broad-spectrum caspase inhibitor z-VAD-fmk leads to an enforced Smac degradation.
Figure 3
Figure 3
Sensitivity analysis predicts key players of apoptosome-dependent signalling. Selected parameters were varied independently from the others by up to two orders of magnitude around the standard value. The influence of the parameter variation on the output signal was investigated by calculating the time required for 20 and 80% substrate cleavage by effector caspases. (A–C) Variation of the cyt-c induced apoptosome formation and Smac release kinetics (time for 50% completion) or the Smac concentration have minor influences on the time required for substrate cleavage. (D–F) Decreasing the procaspase-9 or procaspase-3 concentrations, or increasing the XIAP concentration significantly delays the time required for substrate cleavage.
Figure 4
Figure 4
XIAP overexpression significantly decelerates apoptotic signalling and inhibits effector caspase activity. (A) A continuous variation of the XIAP concentration reveals a threshold between 0.15 and 0.30 μM deciding of efficient substrate cleavage by effector caspases. At high XIAP concentrations, substrate cleavage is potently blocked. (B) Comparison of XIAP expression levels. Western blot comparing XIAP expression levels of HeLa cells infected with AdV-LacZ or AdV-XIAP. β-Actin served as loading control. (C) Mitochondrial depolarisation and subsequent effector caspase activation are shown for a representative HeLa cell infected with AdV-XIAP (m.o.i. 100) and treated with 1 μM STS. Mitochondrial depolarisation is shown as a decrease in TMRM fluorescence. Effector caspase activation was detected by an increase in the CFP/YFP emission ratio owing to proteolytic cleavage of a CFP-DEVD-YFP fusion protein. Scale bar=10 μm. Time stamps show the time after stimulus addition. (D) Model-calculated substrate cleavage kinetics around 4.5-fold XIAP overexpression (0.26–0.30 μM). (E) Submaximal substrate cleavage upon XIAP overexpression. Microscopy images were quantitatively analysed and traces for three XIAP overexpressing HeLa cells treated with 1 μM STS are shown. Traces were synchronised to the time point of depolarisation for comparability to the model predictions in (D). (F) Delay between mitochondrial depolarisation and effector caspase activation. Data from n=32 (AdV-LacZ) and 41 (AdV-XIAP) cells are shown as median±first and third quartiles, respectively. Noninfected cells served as controls (n=16). XIAP overexpression significantly delayed effector caspase activation after MOMP when compared to LacZ-infected cells (P=3.6 × 10⁻¹⁰; Mann–Whitney U-test). Model predictions (Calc) are shown as comparison. (G) Evaluation of substrate cleavage kinetics of single cells. CFP/YFP ratio traces for single cells were fitted with a sigmoid Boltzmann function. dt determines the width of the turnover of the sigmoid function. Data from n=27 (AdV-LacZ) and n=41 (AdV-XIAP) cells are shown as median±first and third quartiles. Noninfected cells served as controls (n=19). XIAP overexpression significantly slowed down substrate cleavage when compared to LacZ-infected cells (P=9.1 × 10⁻⁶; independent samples t-test). Model predictions (Calc) are shown as comparison.
Figure 5
Figure 5
Smac overexpression does not accelerate substrate cleavage kinetics in HeLa cells. (A) Model prediction that increases in Smac concentration do not substantially alter substrate cleavage kinetics. (B) Evaluation of FRET substrate cleavage kinetics in single HeLa cells overexpressing Smac. Substrate cleavage traces for single cells were fitted with a sigmoid Boltzmann function. dt determines the width of the turnover of the sigmoid function. Data from n=20 or 19 cells are shown as mean+s.e.m. (P=0.97; U-test).
Figure 6
Figure 6
Role of caspase-3 feedback signalling in all-or-none caspase activation. (A–F) Model responses for apoptotic signalling with (A, C, E) or without (B, D, F) caspase-3. Upon loss of caspase-3, caspase-7 served as the central effector caspase. (A, B) Temporal effector caspase activation profiles upon varying the initial procaspase concentrations. (A) Caspase-3 activation is rapid and results in a sharp peak of free active caspase-3 (caspase-3 that is not inhibited by XIAP or BIR1-2). A high percentage of the overall amount of procaspase gets activated. (B) In the absence of caspase-3, caspase-7 activation is slow, does not exceed ∼35% of the initial amount of procaspase-7 and is not detectable at concentrations below ∼0.35 μM. (C, D) Temporal profiles of substrate cleavage upon varying the initial procaspase concentrations. (C) In caspase-3-expressing cells, small concentrations of procaspase-3 are sufficient to result in complete substrate cleavage whereas (D) considerably higher amounts of procaspase-7 are needed for complete substrate cleavage. (E, F) Substrate cleavage as a consequence of the procaspase/XIAP balance. (E) Only on substantial overexpression of XIAP substrate cleavage can be inhibited in presence of caspase-3, whereas a slight overexpression of XIAP in caspase-3-deficient cells results in a complete inhibition of substrate cleavage (F). Arrow points at the standard conditions in HeLa cells. (G–H) Experimental results from single-cell analyses of caspase-3-deficient MCF-7 cells. (G) FRET substrate cleavage is significantly delayed upon loss of caspase-3. Data from n=26, 23 and 10 cells are shown as mean±s.e.m. MCF-7 cells show a delay in substrate cleavage following depolarisation (P=0.08; U-test). Overexpression of XIAP in MCF-7/C3 cells delays substrate cleavage to a similar extent (P=0.04; U-test). NA, not applicable. (H) MCF-7/caspase-3 and MCF-7 cells infected with either β-galactosidase or XIAP expression adenoviruses (AdV-LacZ; AdV-XIAP; m.o.i. 100) were treated with 1 μM STS. Cells not showing effector caspase activity following mitochondrial depolarisation were quantified.

References

    1. Arama E, Agapite J, Steller H (2003) Caspase activity and a specific cytochrome C are required for sperm differentiation in Drosophila. Dev Cell 4: 687–697 - PubMed
    1. Arnoult D, Gaume B, Karbowski M, Sharpe JC, Cecconi F, Youle RJ (2003) Mitochondrial release of AIF and EndoG requires caspase activation downstream of Bax/Bak-mediated permeabilization. EMBO J 22: 4385–4399 - PMC - PubMed
    1. Arnt CR, Chiorean MV, Heldebrant MP, Gores GJ, Kaufmann SH (2002) Synthetic Smac/DIABLO peptides enhance the effects of chemotherapeutic agents by binding XIAP and cIAP1 in situ. J Biol Chem 277: 44236–44243 - PubMed
    1. Bagci EZ, Vodovotz Y, Billiar TR, Ermentrout GB, Bahar I (2006) Bistability in apoptosis: roles of bax, bcl-2, and mitochondrial permeability transition pores. Biophys J 90: 1546–1559 - PMC - PubMed
    1. Bentele M, Lavrik I, Ulrich M, Stosser S, Heermann DW, Kalthoff H, Krammer PH, Eils R (2004) Mathematical modeling reveals threshold mechanism in CD95-induced apoptosis. J Cell Biol 166: 839–851 - PMC - PubMed

Publication types

MeSH terms