Comparative Study
. 2007 Feb;133(2):83-92.
doi: 10.1007/s00432-006-0140-6. Epub 2006 Aug 24.

Dominant-negative E-cadherin inhibits the invasiveness of inflammatory breast cancer cells in vitro

Affiliations
Comparative Study

Dominant-negative E-cadherin inhibits the invasiveness of inflammatory breast cancer cells in vitro

Hui-Ming Dong et al. J Cancer Res Clin Oncol. 2007 Feb.

Abstract

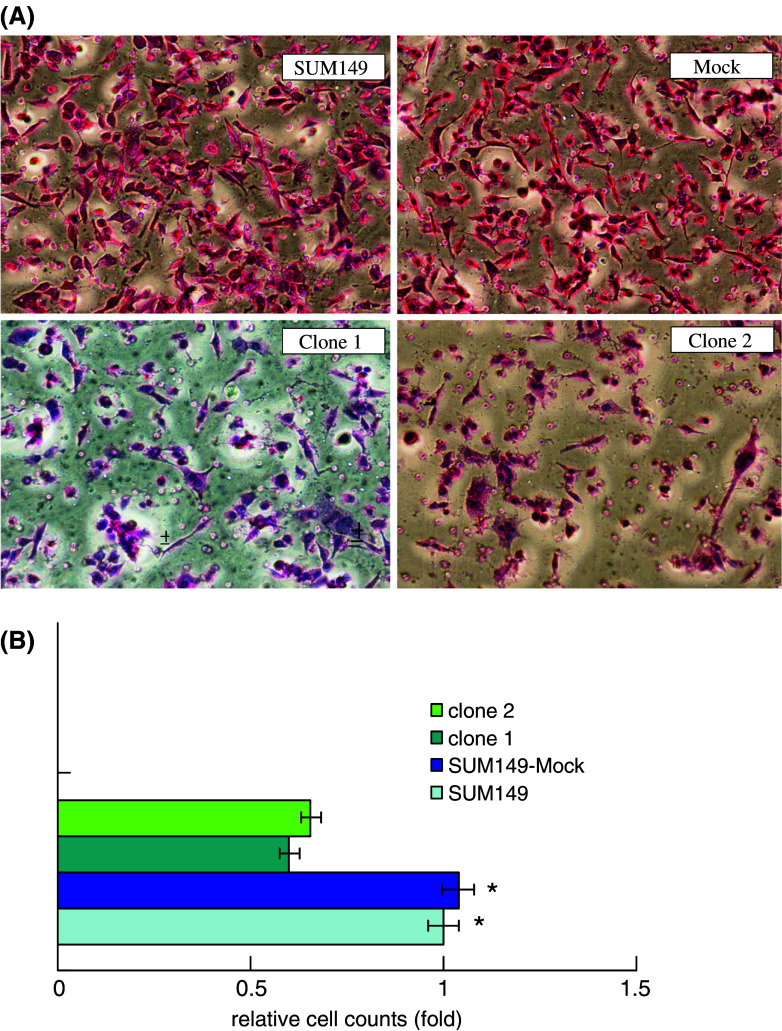
E-cadherin is a transmembrane glycoprotein which mediates epithelial cell-to-cell adhesion function as a tumor suppressor and frequently loss of expression in a wide spectrum of human cancer. However, recent studies demonstrated that E-cadherin was always over-expressed in inflammatory breast cancer (IBC) specimen and cell lines, which is a clinical extreme malignancy of breast cancer. It is hypothesized that the gain and not the loss of the E-cadherin axis contributes to the IBC unique phenotype. To test this assumption, we generated dominant negative mutant E-cadherin high-expression inflammatory breast cancer cells by introduced dominant negative mutant E-cadherin (H-2kd-E-cad) cDNA into human IBC SUM149 cells. Our studies demonstrated that the ability of invasion of SUM149 cells was significantly inhibited by H-2kd-E-cad via down-regulation of MMP-1 and MMP-9 expression. The underlying signal pathway of MAPK phosphorylated Erk 1/2(P44/42) in H-2kd-E-cad-transfected SUM149 cells was significantly down-regulated compared to parental and mock contrast. Our studies provided further functional evidence as the gain of E-cadherin expression dedicated to the IBC malignant phenotype and the blockage of MAPK/Erk activation maybe a promising therapeutic target.


Figures

Fig. 1
Fig. 1
a Expression of H-2kd was detected by RT-PCR. Lane 1 SUM149, lane 2 SUM149-Mock, lane 3 clone 1: SUM149/H-2kd1, lane 4 clone 2: SUM149/H-2kd2, lane 5 negative control (total mRNA sample of SUM149/H-2kd1 without reverse transcription). b Expression of H-2kd was detected by flow cytometry analysis using FITC-conjugated mouse anti-H-2kd antibody
Fig. 2
Fig. 2
a. Expression of E-cadherin was detected by RT-PCR. Lane 1 SUM149, lane 2 SUM149-Mock, lane 3 clone 1: SUM149/H-2kd1, lane 4 clone 2: SUM149/H-2kd2, lane 5negative control (total mRNA sample of SUM149/H-2kd1 without reverse transcription). b Representative quantitation of three independent experiments. The values are expressed relative to respective controls, which are given an arbitrary value of 1. The error bars represent the standard errors (*P < 0.05). c Protein levels of E-cadherin were detected by Western blot in SUM149 (Lane 1) SUM149-Mock (lane 2) SUM149/H-2kd1 (lane 3), SUM149/H-2kd2 (lane 4). d Representative quantitation of three independent experiments. The values are expressed relative to respective controls, which are given an arbitrary value of 1. The error bars represent the standard errors (*P < 0.05)
Fig. 3
Fig. 3
a The in vitro invasion assay using the classic Transwell. b The quantitation of the invasion ability. The data are representative three independent experiments. The values are expressed relative to respective controls. (*P < 0.05)
Fig. 4
Fig. 4
a The expression levels of MMPs was detected by RT-PCR. Lane 1 SUM149, lane 2 SUM149-Mock, lane 3 clone 1: SUM149/H-2kd1, lane 4 clone 2. SUM149/H-2kd2, lane 5 negative control (total mRNA sample of SUM149/H-2kd1 without reverse transcription). b Representative quantitation of three independent experiments. The values are expressed relative to respective controls, which are given an arbitrary value of 1. The error bars represent the standard errors. (*P < 0.05) c The quantitation of the activity levels of MMP-9 were detected by gelatin zymography. The data are representative three independent experiments. The values are expressed relative to respective controls, which are given an arbitrary value of 1. The error bars represent the standard errors (*P < 0.05)
Fig. 5
Fig. 5
a Protein levels of P44/42 were detected by Western blot. Lane 1 SUM149, lane 2, SUM149-Mock, lane 3 clone 1: SUM149/H-2kd1, lane 4 clone 2: SUM149/H-2kd2. b Representative quantitation of three independent experiments. The values are expressed relative to respective controls, which are given an arbitrary value of 1. The error bars represent the standard errors (*P < 0.05)

References

    1. Albini A (1998) Tumor, endothelial cell invasion of basement membranes. The matrigel chemoinvasion assay as a tool for dissecting molecular mechanisms. Pathol Oncol Res 4:230–241 - PubMed
    1. Alpaugh ML, Tomlinson JS, Shao ZM, Barsky SH (1999) A novel human xenograft model of inflammatory breast cancer. Cancer Res 59:5079–5084 - PubMed
    1. Amagai M, Fujimori T, Masunaga T, Shimizu H, Nishikawa T, Shimizu N et al (1995) Delayed assembly of desmosomes in keratinocytes with disrupted classic-cadherin-mediated cell adhesion by a dominant negative mutant. J Invest Dermatol 104:27–32 - PubMed
    1. Birchmeier W, Behrens J (1994) Cadherin expression in carcinomas: role in the formation of cell junctions and the prevention of invasiveness. Biochim Biophys Acta 1198:11–26 - PubMed
    1. Braga VM (2002) Cell–cell adhesion and signalling. Curr Opin Cell Biol. 14:546–556 - PubMed

Publication types

MeSH terms