. 2006 Aug 18;2(8):e108.
doi: 10.1371/journal.pcbi.0020108.

Modeling somatic evolution in tumorigenesis

Affiliations

Modeling somatic evolution in tumorigenesis

Sabrina L Spencer et al. PLoS Comput Biol. .

Abstract

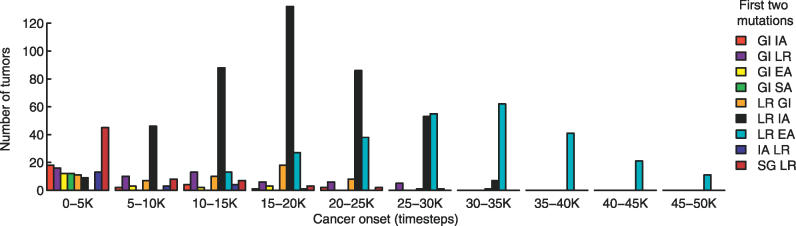
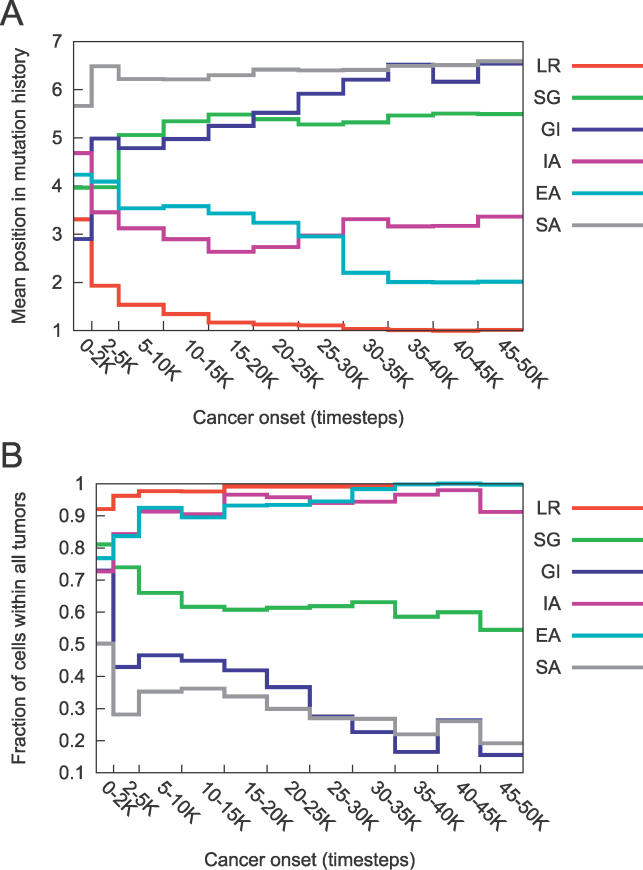
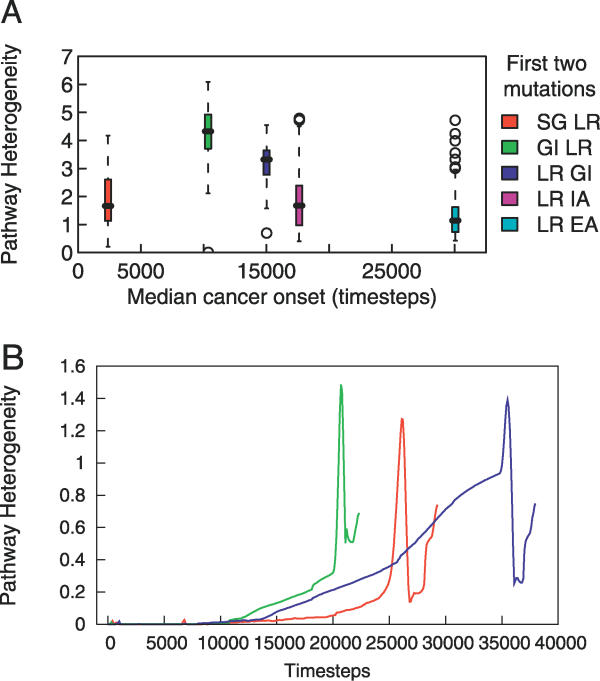
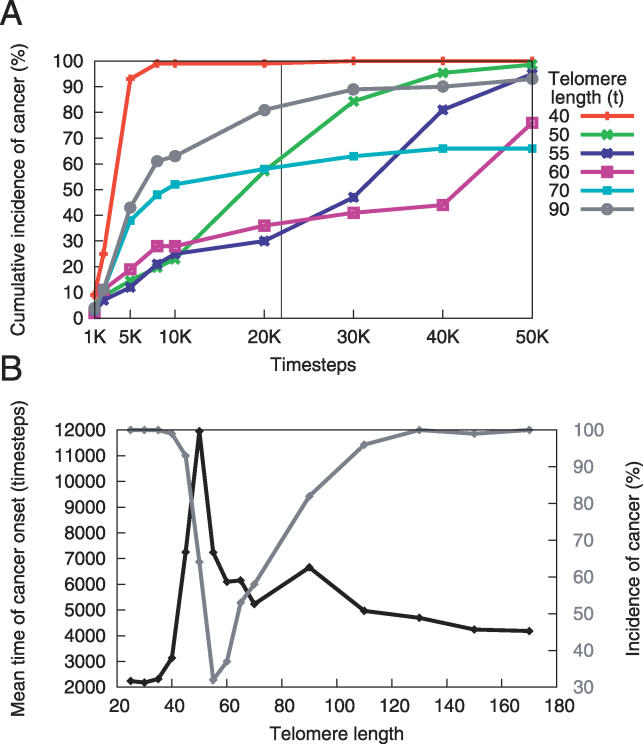
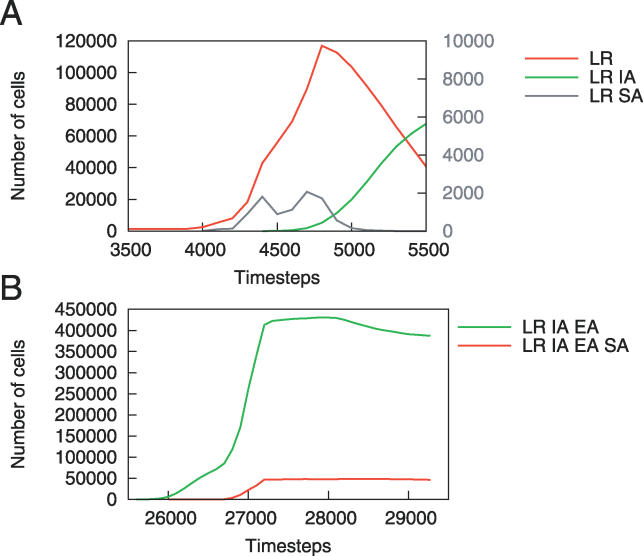
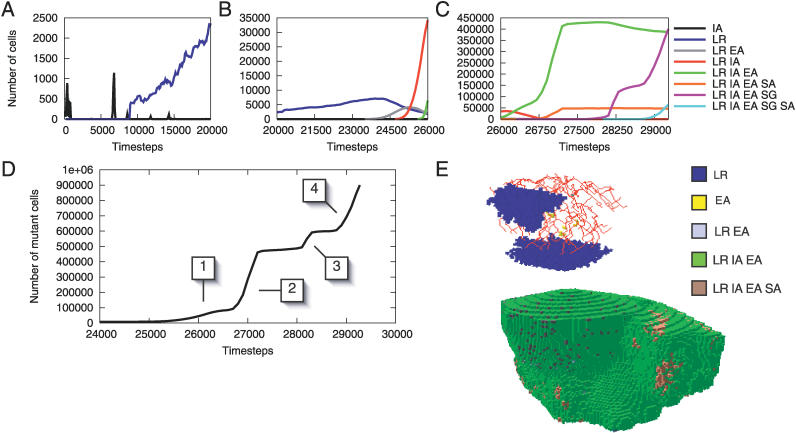
Tumorigenesis in humans is thought to be a multistep process where certain mutations confer a selective advantage, allowing lineages derived from the mutated cell to outcompete other cells. Although molecular cell biology has substantially advanced cancer research, our understanding of the evolutionary dynamics that govern tumorigenesis is limited. This paper analyzes the computational implications of cancer progression presented by Hanahan and Weinberg in The Hallmarks of Cancer. We model the complexities of tumor progression as a small set of underlying rules that govern the transformation of normal cells to tumor cells. The rules are implemented in a stochastic multistep model. The model predicts that (i) early-onset cancers proceed through a different sequence of mutation acquisition than late-onset cancers; (ii) tumor heterogeneity varies with acquisition of genetic instability, mutation pathway, and selective pressures during tumorigenesis; (iii) there exists an optimal initial telomere length which lowers cancer incidence and raises time of cancer onset; and (iv) the ability to initiate angiogenesis is an important stage-setting mutation, which is often exploited by other cells. The model offers insight into how the sequence of acquired mutations affects the timing and cellular makeup of the resulting tumor and how the cellular-level population dynamics drive neoplastic evolution.


Conflict of interest statement

Competing interests. The authors have declared that no competing interests exist.

Figures

Figure 1
Figure 1. The Timing of Cancer Onset Is Correlated with the Most Common First Two Mutations of a Tumor
The most common first two mutations of a tumor define the dominant tumor type. GI is the most common first mutation in the 0–5 K timeblock, as seen by summing the populations with GI as the first mutation. The prevalence of GI IA, GI EA, GI SA, IA LR, and SG LR, decreases after 5,000 time steps, while GI LR and LR GI remain roughly constant for several time blocks. The sequences LR IA and LR EA are distributed around 15–20 K and 30–35 K time steps, respectively. Dominant tumor types not shown occur in less than 2% of the 986 runs ending in cancer.
Figure 2
Figure 2. Pathways to Cancer Vary with the Timing of Cancer Onset
(A) Average position of the mutations in the pathways present in the 986 runs that terminated in cancer, for tumors acquired in the timeblocks specified on the x-axis. A position of one indicates that it was the first mutation of a pathway. A position of seven indicates that a given mutation did not appear in the pathway. For cancers arising before 2,000 time steps, GI was frequently the first mutation, as it has the lowest mean position. As time progresses and telomere length shortens, LR becomes the first mutation in all pathways. Standard deviation and sample size data are included in Table S2. (B) Fraction of all cells in all tumors carrying a given mutation, in which cancer onset occurred in the timeblocks specified on the x-axis. Cells with mutations in LR, IA, and EA make up the majority of the tumors. The frequency of GI drops substantially as time of cancer onset increases, whereas the frequency of SA remains low for all timeblocks.
Figure 3
Figure 3. Tumor Heterogeneity
(A) The five most common tumor categories, defined by the most common first two mutations, vary in their pathway heterogeneity. (B) Example dynamics of heterogeneity during the development of three tumors. Each line corresponds to the development of one tumor; the red curve corresponds to the tumor discussed in the Sample Simulation Run section. As the tumor begins to form, there is typically a slow increase in the degree of tissue heterogeneity followed by a sudden increase, an equally sudden decrease, and then often another increase as the tissue reaches 9 × 10⁵ cells.
Figure 4
Figure 4. Initial Telomere Length Affects Incidence and Onset of Cancer
(A) Initial telomere length affects the pattern of incidence across time. Each point in time on the x-axis represents the cumulative incidence of cancers that arose before that time. The initial telomere length governs the tradeoff between the incidence of early and late cancer onset. Short (40 units) and long (90 units) telomeres produce an earlier, higher incidence of cancer than do telomeres of intermediate length. (B) Mean onset time and incidence for cancers acquired before 21,900 time steps as a function of initial telomere length. This subfigure represents a snapshot at time t = 21,900, indicated by the vertical black line in (A). Note that the gray curve corresponds to the secondary y-axis.
Figure 5
Figure 5. SA Creates a Niche for Other Cell Populations
(A) A population of LR SA cells (secondary y-axis) allows the population of LR cells to proliferate. Eventually, the LR IA cells replace the LR SA cells, temporarily preventing the development of new vasculature. (B) In this case, the cells creating the blood supply have additional mutations, allowing the LR IA EA SA population to plateau rather than decline, as occurred in the case of the LR SA cells in (A).
Figure 6
Figure 6. Cell Dynamics of the Sample Run
Top row: growth dynamics of mutant cells in three graphs corresponding to three different time periods. (A) Populations with IA rise and fall, and cells with LR emerge. (B) Around time step 24,000, a cell with LR EA undergoes clonal expansion, resulting in a decline of the parent LR population. Near time step 25,000, cells with LR IA begin to outcompete the LR EA population. (C) At time step 26,000, cells with LR IA EA expand while the LR IA population declines. The emergence of a clonal population with LR IA EA SA provides the angiogenesis for the LR IA EA population to expand rapidly. At time step 28,000, LR IA EA SG cells begin to double the size of the tumor, aided by the LR IA EA SG SA cells. (D) The aggregate cell proliferation pattern in mutant cells. The boxed numbers indicate clonal expansions that result from overcoming proliferation bottlenecks. The first expansion occurs with the acquisition of IA. The second expansion is the result of an SA mutation. The third occurs with the acquisition of SG, and the final expansion occurs with the acquisition of SA. (E) The tissue at time step 20,780 (top) and 26,982 (bottom). Normal cells have been removed from the image to reveal two clonal populations with LR at time step 20,780. At time step 26,982, the tumor has grown beyond the normal tissue extent through the acquisition of SA.

References

    1. Cahill DP, Kinzler KW, Vogelstein B, Lengauer C. Genetic instability and Darwinian selection in tumours. Trends Cell Biol. 1999;9:M57–M60. - PubMed
    1. Frank S, Nowak M. Problems of somatic mutation and cancer. BioEssays. 2004;26:291–299. - PubMed
    1. Nowell PC. The clonal evolution of tumor cell populations. Science. 1976;194:23–28. - PubMed
    1. Armitage P, Doll R. The age distribution of cancer and a multistage theory of carcinogenesis. Br J Cancer. 1954;8:1–12. - PMC - PubMed
    1. Renan MJ. How many mutations are required for tumorigenesis? Implications from human cancer data. Mol Carcinog. 1993;7:139–146. - PubMed

Publication types

Substances