

Heritability of cardiovascular and personality traits in 6,148 Sardinians
- PMID: 16934002
- PMCID: PMC1557782
- DOI: 10.1371/journal.pgen.0020132
Heritability of cardiovascular and personality traits in 6,148 Sardinians
Abstract
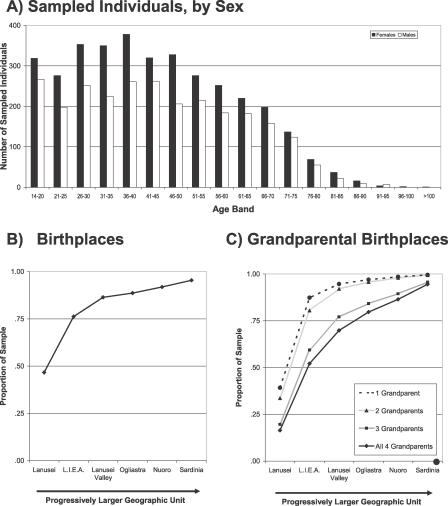
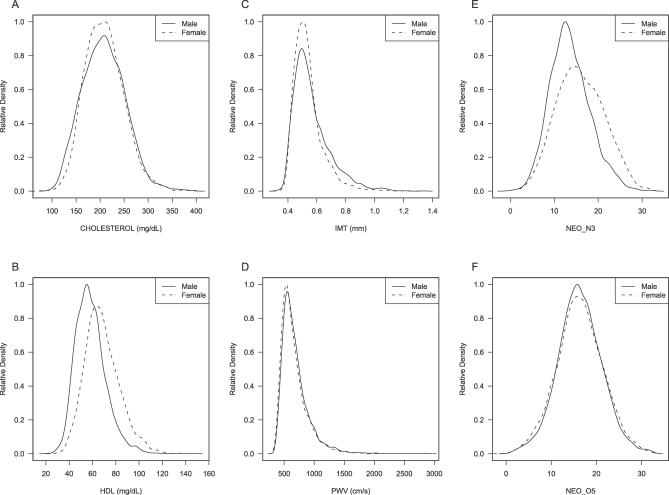
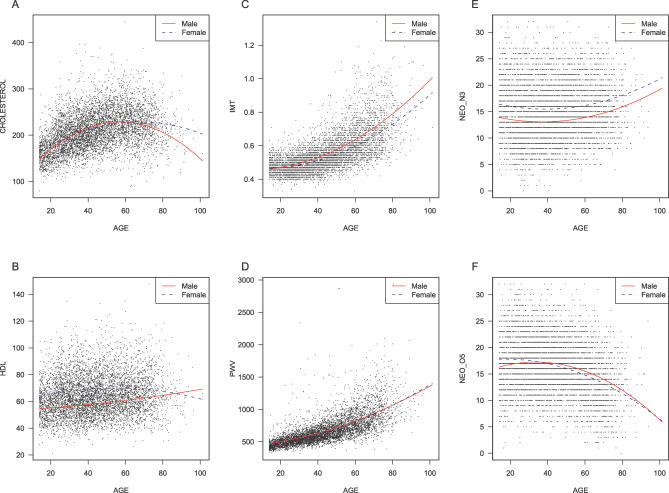
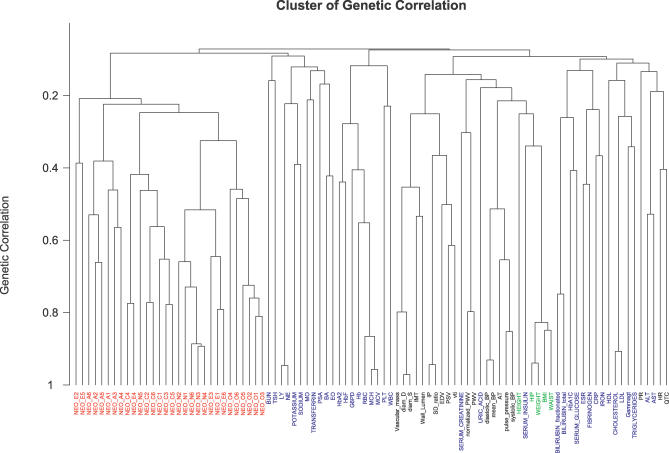
In family studies, phenotypic similarities between relatives yield information on the overall contribution of genes to trait variation. Large samples are important for these family studies, especially when comparing heritability between subgroups such as young and old, or males and females. We recruited a cohort of 6,148 participants, aged 14-102 y, from four clustered towns in Sardinia. The cohort includes 34,469 relative pairs. To extract genetic information, we implemented software for variance components heritability analysis, designed to handle large pedigrees, analyze multiple traits simultaneously, and model heterogeneity. Here, we report heritability analyses for 98 quantitative traits, focusing on facets of personality and cardiovascular function. We also summarize results of bivariate analyses for all pairs of traits and of heterogeneity analyses for each trait. We found a significant genetic component for every trait. On average, genetic effects explained 40% of the variance for 38 blood tests, 51% for five anthropometric measures, 25% for 20 measures of cardiovascular function, and 19% for 35 personality traits. Four traits showed significant evidence for an X-linked component. Bivariate analyses suggested overlapping genetic determinants for many traits, including multiple personality facets and several traits related to the metabolic syndrome; but we found no evidence for shared genetic determinants that might underlie the reported association of some personality traits and cardiovascular risk factors. Models allowing for heterogeneity suggested that, in this cohort, the genetic variance was typically larger in females and in younger individuals, but interesting exceptions were observed. For example, narrow heritability of blood pressure was approximately 26% in individuals more than 42 y old, but only approximately 8% in younger individuals. Despite the heterogeneity in effect sizes, the same loci appear to contribute to variance in young and old, and in males and females. In summary, we find significant evidence for heritability of many medically important traits, including cardiovascular function and personality. Evidence for heterogeneity by age and sex suggests that models allowing for these differences will be important in mapping quantitative traits.
Conflict of interest statement
Competing interests. The authors have declared that no competing interests exist.
Figures
References
-
- Cardon LR, Bell JI. Association study designs for complex diseases. Nat Rev Genet. 2001;2:91–99. - PubMed
-
- Peltonen L, Palotie A, Lange K. Use of population isolates for mapping complex traits. Nat Rev Genet. 2000;1:182–190. - PubMed
-
- Wright AF, Carothers AD, Pirastu M. Population choice in mapping genes for complex diseases. Nat Genet. 1999;23:397–404. - PubMed
-
- Lampis R, Morelli L, De Virgiliis S, Congia M, Cucca F. The distribution of HLA class II haplotypes reveals that the Sardinian population is genetically differentiated from the other Caucasian populations. Tissue Antigens. 2000;56:515–521. - PubMed
Publication types
MeSH terms
Grants and funding
LinkOut - more resources
Full Text Sources
Molecular Biology Databases
