. 2006 Aug 25:7:390.
doi: 10.1186/1471-2105-7-390.

PET-Tool: a software suite for comprehensive processing and managing of Paired-End diTag (PET) sequence data

Affiliations

PET-Tool: a software suite for comprehensive processing and managing of Paired-End diTag (PET) sequence data

Kuo Ping Chiu et al. BMC Bioinformatics. .

Abstract

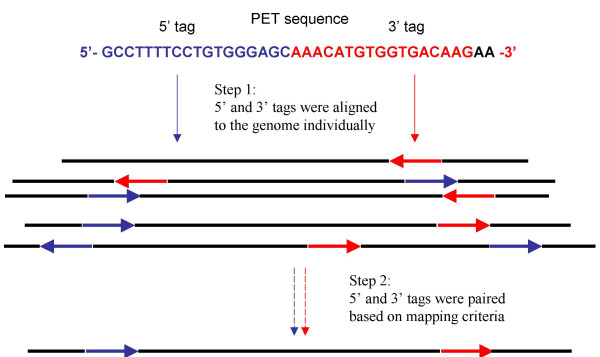
Background: We recently developed the Paired End diTag (PET) strategy for efficient characterization of mammalian transcriptomes and genomes. The paired end nature of short PET sequences derived from long DNA fragments raised a new set of bioinformatics challenges, including how to extract PETs from raw sequence reads, and correctly yet efficiently map PETs to reference genome sequences. To accommodate and streamline data analysis of the large volume PET sequences generated from each PET experiment, an automated PET data process pipeline is desirable.

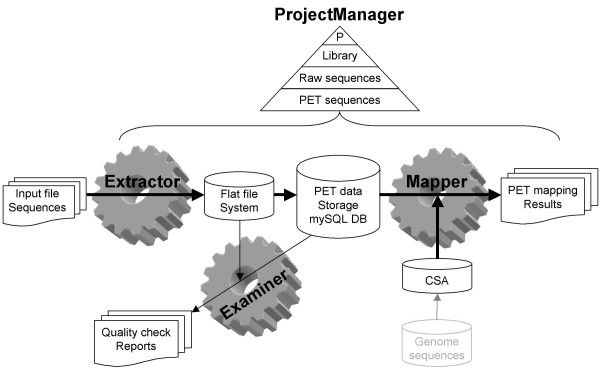
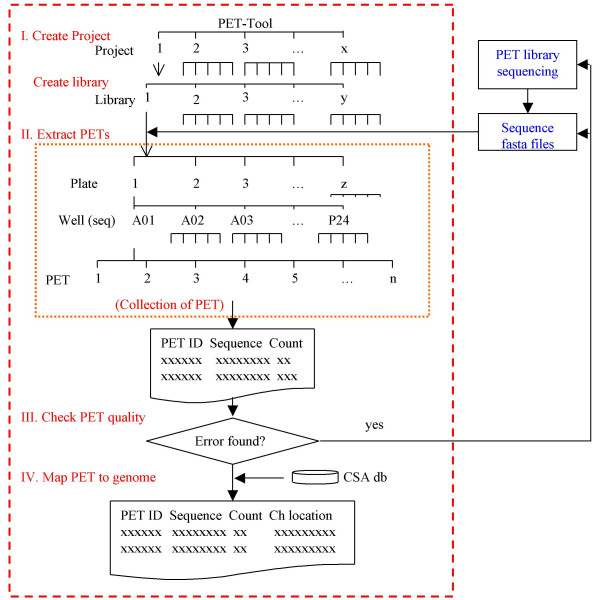
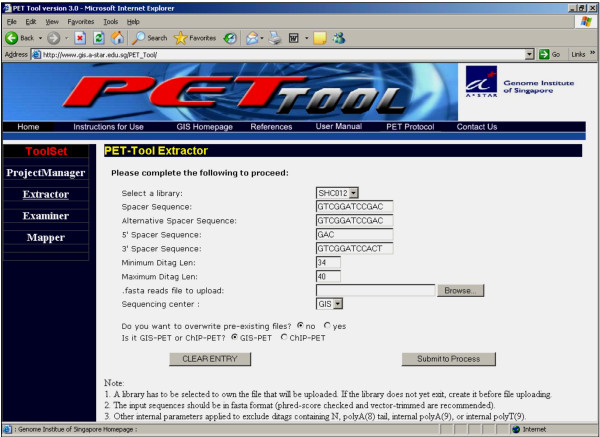
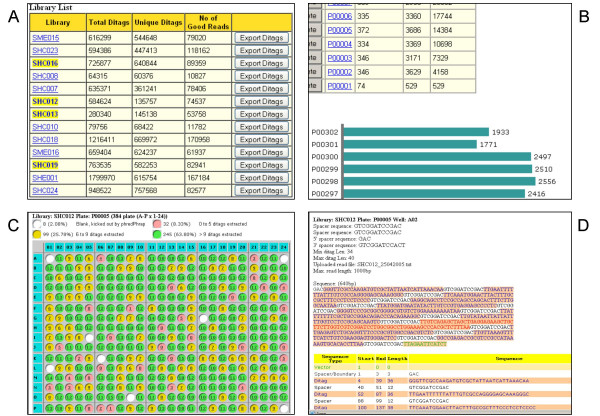
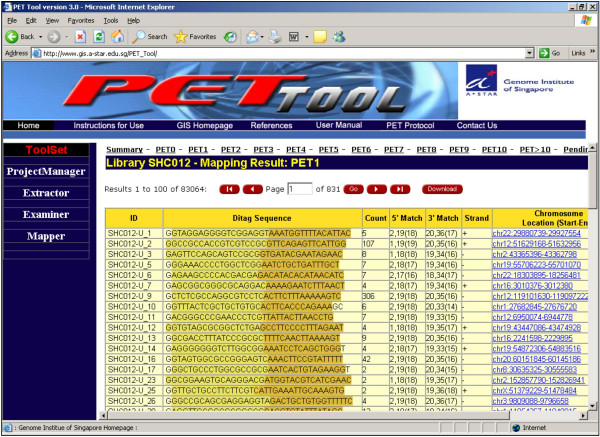
Results: We designed an integrated computation program package, PET-Tool, to automatically process PET sequences and map them to the genome sequences. The Tool was implemented as a web-based application composed of four modules: the Extractor module for PET extraction; the Examiner module for analytic evaluation of PET sequence quality; the Mapper module for locating PET sequences in the genome sequences; and the Project Manager module for data organization. The performance of PET-Tool was evaluated through the analyses of 2.7 million PET sequences. It was demonstrated that PET-Tool is accurate and efficient in extracting PET sequences and removing artifacts from large volume dataset. Using optimized mapping criteria, over 70% of quality PET sequences were mapped specifically to the genome sequences. With a 2.4 GHz LINUX machine, it takes approximately six hours to process one million PETs from extraction to mapping.

Conclusion: The speed, accuracy, and comprehensiveness have proved that PET-Tool is an important and useful component in PET experiments, and can be extended to accommodate other related analyses of paired-end sequences. The Tool also provides user-friendly functions for data quality check and system for multi-layer data management.


Figures

Figure 1
Figure 1
A schematic view of architecture design for PET-Tool. PET-Tool has four functional modules, Extractor, Examiner, Mapper, and ProjectManager. Extractor uploads sequence files and dissects the PET sequences from raw sequences. Examiner provides analytical functions for users to evaluate the extraction results and PET sequence quality. Mapper searches the genome database for the mapping locations of the PET sequences. ProjectManager is a hierarchical information management system. 'P' stands for "project". 'CSA' stands for "compressed suffix array", which in this instance is derived from the human genome assembly hg17.
Figure 2
Figure 2
Process flow of PET data Analysis in PET-Tool. Experimental information for each PET library was entered into the system through the ProjectManager functions. High quality DNA sequences in the FASTA files of PET libraries were uploaded through Extractor. Extracted PETs and all related information were stored in a mySQL database. Virtually, PETs were organized in a hierarchical order from project to library, plate, well, and individual PTE. Each unique PET was assigned a unique ID and accorded with copy number (count). The quality of PET extraction was evaluated using Examiner. Errors that occurred in any steps in PET extraction or PET library construction and sequencing could be identified for correction. After PET extraction was validated, PET sequences were mapped to the genome sequences, and the mapping coordinates for each of the PETs were reported in table format.
Figure 3
Figure 3
PET extraction using the Extractor module. The process of PET extraction is initiated through the opening of 'Extractor' listed under the 'ToolSet'. Once a library is selected, library-specific parameters related to PET extraction will show up, such as spacer sequences and minimum/maximum PET length previously entered during library creation. Once the extraction parameters are confirmed or modified by the users, the DNA sequence file in FASTA format is browsed and uploaded. The 'sequencing center' accommodates different naming conventions for sequence IDs (used in input files) generated by different sequencing centers. The selection of a given naming convention method from the 'sequencing center' is needed for the system to properly parse individual sequences in groups of specific wells and plates for particular libraries. The user also needs to specify if the library is a GIS-PET or ChIP-PET library.
Figure 4
Figure 4
Functions of the Examiner module. PET extraction results can be viewed at various levels (library, plate, well, and nucleotide sequence). A. The library view of PET extraction result. The 4 libraries analyzed in this study were highlighted. The numbers of total PETs, unique PETs, and high quality sequence reads used for PET extraction are shown. B. The plate view of PET extraction results. Individual plates (plate ID) and the number of quality sequences, total PETs and cumulative PETs are shown in table format as well as graphic bar display. C. The 384-well view of PET extraction results. The digit in each well stands for the number of PETs generated from the sequence in that well. Each well is also color coded for 4 different categories based on the number of PETs produced. The 4 categories are summarized at the top panel of the table. D. Individual sequence view of PET extraction results. A sequence was dissected into spacer sequences and the putative PET sequences in between two adjacent spacers. The spacer sequences are in black and with plain background, and the sequences in between spacers are highlighted in orange color. The good PET sequences are in blue, and the bad sequences in red. The sequence segments are further tabulated with detailed information regarding the position and the length of each segment.
Figure 5
Figure 5
Mapping of PETs to the genome. The 5' and 3' tags of a PET were split and separately mapped to the human genome sequences. Due to the short length of tags and the complexity of the human genome, some of the tags could be mapped non-specifically to multiple locations in the genome. The 5' and 3' tags derived from the same PET were mated based on the criteria that the paired 5' and 3' tags had to be in the correct orientation and order (5'→3'), on the same chromosome, and within the defined appropriate distance.
Figure 6
Figure 6
Mapping report of a PET library. The PET mapping results of a library were tabulated and reported. The table included the ID number for each of the unique PETs, PET sequences, PET counts, alignment specificities for 5' and 3' tags, PET mapping orientations (DNA strand, + or -), and PET genomic coordinates.

References

    1. Velculescu VE, Zhang L, Vogelstein B, Kinzler KW. Serial analysis of gene expression. Science. 1995;270:484–487. - PubMed
    1. Saha S, Sparks AB, Rago C, Akmaev V, Wang CJ, Vogelstein B, Kinzler KW. Using the transcriptome to annotate the genome. Nature Biotechnol. 2002;20:508–512. doi: 10.1038/nbt0502-508. - DOI - PubMed
    1. Wang TL, Maierhofer C, Speicher MR, Lengauer C, Vogelstein B, Kinzler KW, Velculescu VE. Digital karyotyping. PNAS USA. 2002;99:16156–16161. doi: 10.1073/pnas.202610899. - DOI - PMC - PubMed
    1. Shiraki T, Kondo S, Katayama S, Waki K, Kasukawa T, Kawaji H, Kodzius R, Watahiki A, Nakamura M, Arakawa T, Fukuda S, Sasaki D, Podhajska A, Harbers M, Kawai J, Carninci P, Hayashizaki Y. Cap analysis gene expression for high-throughput analysis of transcriptional starting point and identification of promoter usage. PNAS USA. 2003;100:15776–15781. doi: 10.1073/pnas.2136655100. - DOI - PMC - PubMed
    1. Hashimoto SI, Suzuki Y, Kasai Y, Morohoshi K, Yamada T, Sese J, Morishita S, Sugano S, Matsushima K. 5' end SAGE for the analysis of transcriptional start sites. Nature biotechnology. 2004;22:1146–1149. doi: 10.1038/nbt998. - DOI - PubMed

Publication types

LinkOut - more resources