

Probe-level linear model fitting and mixture modeling results in high accuracy detection of differential gene expression
- PMID: 16934150
- PMCID: PMC1579233
- DOI: 10.1186/1471-2105-7-391
Probe-level linear model fitting and mixture modeling results in high accuracy detection of differential gene expression
Abstract
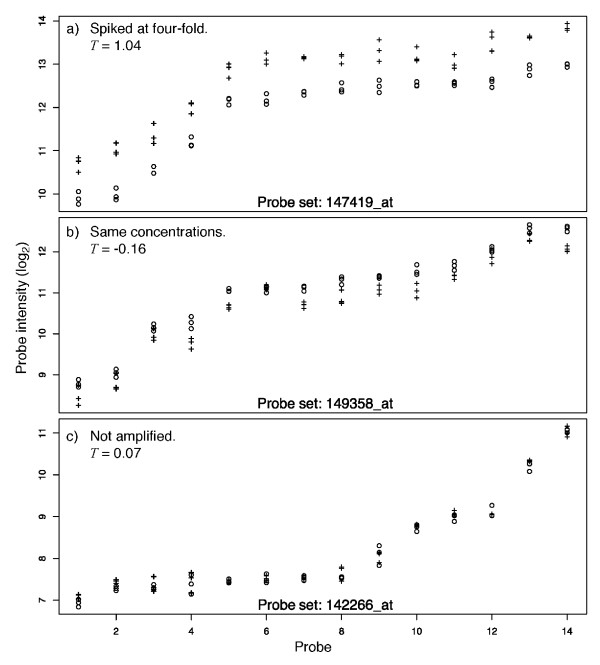
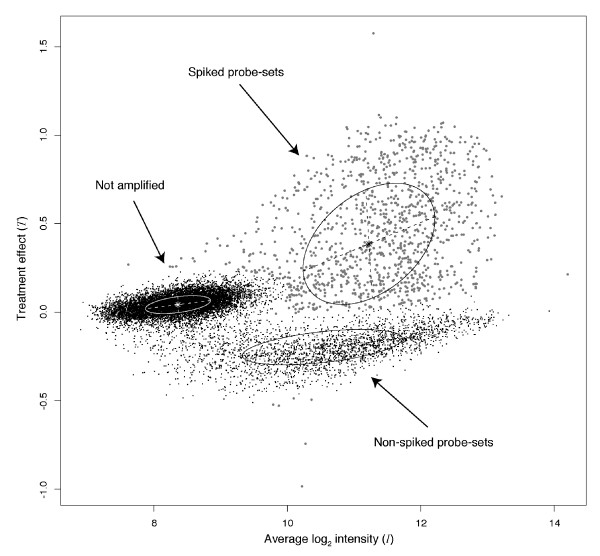
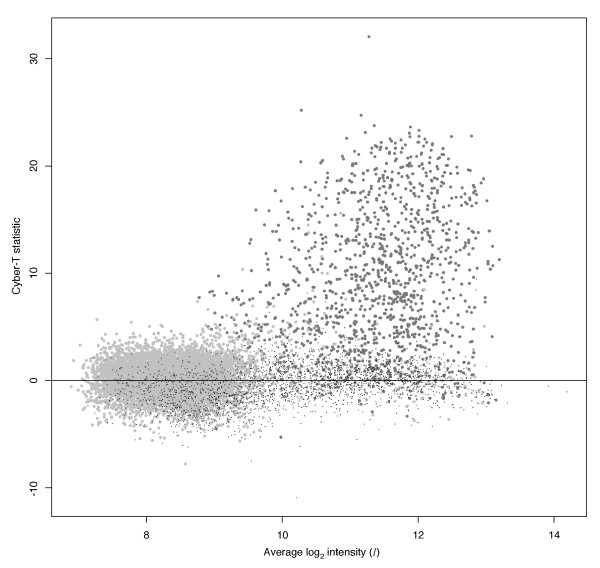
Background: The identification of differentially expressed genes (DEGs) from Affymetrix GeneChips arrays is currently done by first computing expression levels from the low-level probe intensities, then deriving significance by comparing these expression levels between conditions. The proposed PL-LM (Probe-Level Linear Model) method implements a linear model applied on the probe-level data to directly estimate the treatment effect. A finite mixture of Gaussian components is then used to identify DEGs using the coefficients estimated by the linear model. This approach can readily be applied to experimental design with or without replication.
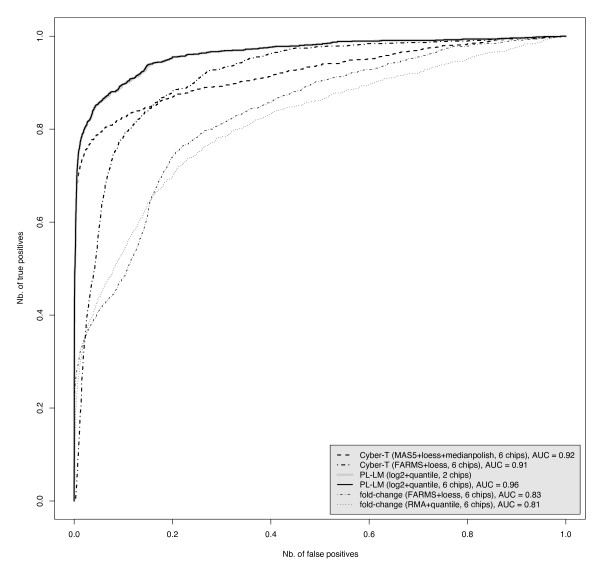
Results: On a wholly defined dataset, the PL-LM method was able to identify 75% of the differentially expressed genes within 10% of false positives. This accuracy was achieved both using the three replicates per conditions available in the dataset and using only one replicate per condition.
Conclusion: The method achieves, on this dataset, a higher accuracy than the best set of tools identified by the authors of the dataset, and does so using only one replicate per condition.
Figures
Similar articles
-
Including probe-level measurement error in robust mixture clustering of replicated microarray gene expression.Stat Appl Genet Mol Biol. 2010;9:Article42. doi: 10.2202/1544-6115.1600. Epub 2010 Dec 9. Stat Appl Genet Mol Biol. 2010. PMID: 21194414
-
Statistical analysis of high-density oligonucleotide arrays: a multiplicative noise model.Bioinformatics. 2002 Dec;18(12):1633-40. doi: 10.1093/bioinformatics/18.12.1633. Bioinformatics. 2002. PMID: 12490448
-
Preferred analysis methods for Affymetrix GeneChips revealed by a wholly defined control dataset.Genome Biol. 2005;6(2):R16. doi: 10.1186/gb-2005-6-2-r16. Epub 2005 Jan 28. Genome Biol. 2005. PMID: 15693945 Free PMC article.
-
Transformation of expression intensities across generations of Affymetrix microarrays using sequence matching and regression modeling.Nucleic Acids Res. 2005 Oct 13;33(18):e157. doi: 10.1093/nar/gni159. Nucleic Acids Res. 2005. PMID: 16224098 Free PMC article.
-
Comparison of seven methods for producing Affymetrix expression scores based on False Discovery Rates in disease profiling data.BMC Bioinformatics. 2005 Feb 10;6:26. doi: 10.1186/1471-2105-6-26. BMC Bioinformatics. 2005. PMID: 15705192 Free PMC article.
Cited by
-
hSETD1A regulates Wnt target genes and controls tumor growth of colorectal cancer cells.Cancer Res. 2014 Feb 1;74(3):775-86. doi: 10.1158/0008-5472.CAN-13-1400. Epub 2013 Nov 18. Cancer Res. 2014. PMID: 24247718 Free PMC article.
-
A comprehensive re-analysis of the Golden Spike data: towards a benchmark for differential expression methods.BMC Bioinformatics. 2008 Mar 26;9:164. doi: 10.1186/1471-2105-9-164. BMC Bioinformatics. 2008. PMID: 18366762 Free PMC article.
-
A comparison of probe-level and probeset models for small-sample gene expression data.BMC Bioinformatics. 2010 May 26;11:281. doi: 10.1186/1471-2105-11-281. BMC Bioinformatics. 2010. PMID: 20504334 Free PMC article.
-
t-Test at the Probe Level: An Alternative Method to Identify Statistically Significant Genes for Microarray Data.Microarrays (Basel). 2014 Dec 16;3(4):340-51. doi: 10.3390/microarrays3040340. Microarrays (Basel). 2014. PMID: 27600352 Free PMC article.
-
Transcriptional Perturbations in Graft Rejection.Transplantation. 2015 Sep;99(9):1882-93. doi: 10.1097/TP.0000000000000809. Transplantation. 2015. PMID: 26154388 Free PMC article.
References
-
- Dudoit S, Yang YH, Callow MJ, Speed TP. Statistical methods for identifying differentially expressed genes in replicated cDNA microarray experiments. Stat Sin. 2002;12:111–139.
-
- Benjamini Y, Hochberg Y. Controlling the False Discovery Rate - a Practical and Powerful Approach to Multiple Testing. Journal of the Royal Statistical Society Series B-Methodological. 1995;57:289–300.
-
- Simon RM, Dobbin K. Experimental design of DNA microarray experiments. Biotechniques. 2003;Suppl:16–21. - PubMed
-
- Affymetrix Statistical Algorithms Description Document http://www.affymetrix.com/support/technical/byproduct.affx?product=mas
Publication types
MeSH terms
Substances
LinkOut - more resources
Full Text Sources
