

The relationship between retinal ganglion cell function and retinal nerve fiber thickness in early glaucoma
- PMID: 16936103
- PMCID: PMC1808329
- DOI: 10.1167/iovs.06-0161
The relationship between retinal ganglion cell function and retinal nerve fiber thickness in early glaucoma
Abstract
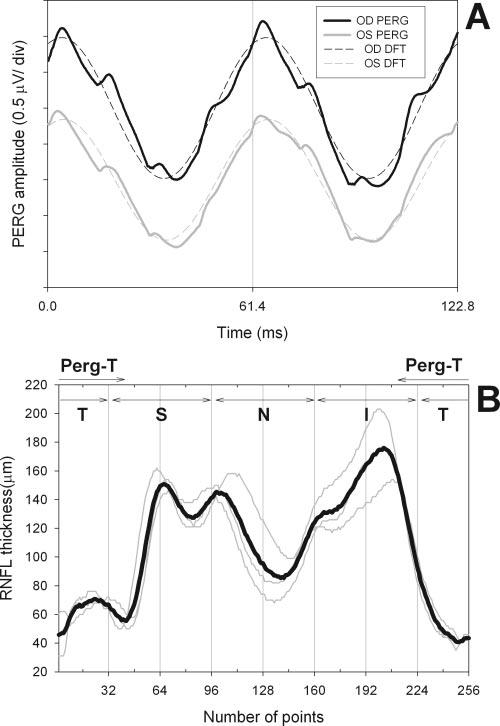
Purpose: To compare relative reduction of retinal ganglion cell (RGC) function and retinal nerve fiber layer (RNFL) thickness in early glaucoma by means of steady-state pattern electroretinogram (PERG) and optical coherence tomography (OCT), respectively.
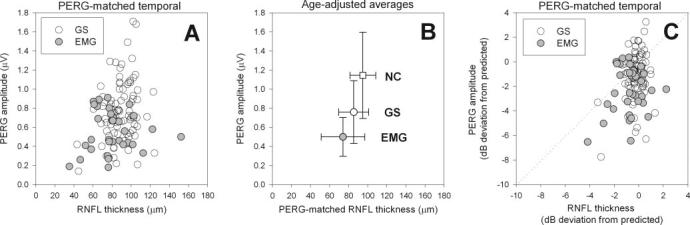
Methods: Eighty-four persons with suspected glaucoma due to disc abnormalities (GS: mean age 56.6 +/- 13.8 years, standard automated perimetry [SAP] mean deviation [MD] -0.58 +/- 1.34 dB) and 34 patients with early manifest glaucoma (EMG, mean age 65.9 +/- 10.7 years, SAP MD -2.7 +/- 4.5 dB) were tested with PERG and OCT. Both GS and EMG patients had small refractive errors, corrected visual acuity > or =20/25, and no systemic or retinal disease other than glaucoma.
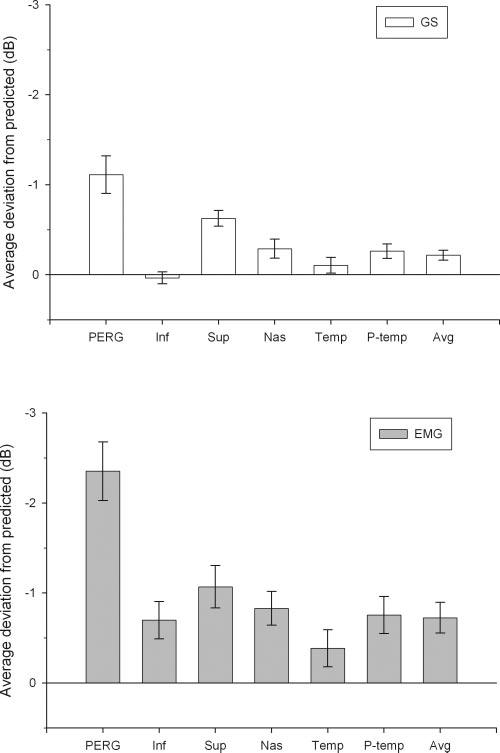
Results: MDs from age-predicted normal values were larger for PERG amplitude (GS: -1.113 dB; EMG: -2.352 dB) compared with the PERG-matched RNFL thickness (GS: -0.217 dB; EMG: -0.725 dB). Deviations exceeding the lower 95% tolerance intervals of the normal population were more frequent for PERG amplitude (GS: 26%; EMG: 56%) than PERG-matched RNFL thickness (GS: 6%; EMG: 29%).
Conclusions: In early glaucoma, reduction in RGC electrical activity exceeds the proportion expected from lost RGC axons, suggesting that a population of viable RGCs in the central retina is dysfunctional. By combining PERG and OCT it is, in principle, possible to obtain unique information on reduced responsiveness of viable RGCs.
Figures
References
-
- Kerrigan-Baumrind LA, Quigley HA, Pease ME, et al. Number of ganglion cells in glaucoma eyes compared with threshold visual field tests in the same persons. Invest Ophthalmol Vis Sci. 2000;41:741–748. - PubMed
-
- Quigley HA, Katz J, Derick RJ, et al. An evaluation of optic disc and nerve fiber layer examinations in monitoring progression of early glaucoma damage. Ophthalmology. 1992;99:19–28. - PubMed
-
- Harwerth RS, Carter-Dawson L, Shen F, et al. Ganglion cell losses underlying visual field defects from experimental glaucoma. Invest Ophthalmol Vis Sci. 1999;40:2242–2250. - PubMed
-
- Harwerth RS, Crawford ML, Frishman LJ, et al. Visual field defects and neural losses from experimental glaucoma. Prog Retin Eye Res. 2002;21:91–125. - PubMed
-
- Swanson WH, Felius J, Pan F. Perimetric defects and ganglion cell damage: interpreting linear relations using a two-stage neural model. Invest Ophthalmol Vis Sci. 2004;45:466–472. - PubMed
Publication types
MeSH terms
Grants and funding
LinkOut - more resources
Full Text Sources
Medical
Research Materials
Miscellaneous
