. 2006 Sep;169(3):761-73.
doi: 10.2353/ajpath.2006.060250.

BAG3 deficiency results in fulminant myopathy and early lethality

Affiliations

BAG3 deficiency results in fulminant myopathy and early lethality

Sachiko Homma et al. Am J Pathol. 2006 Sep.

Abstract

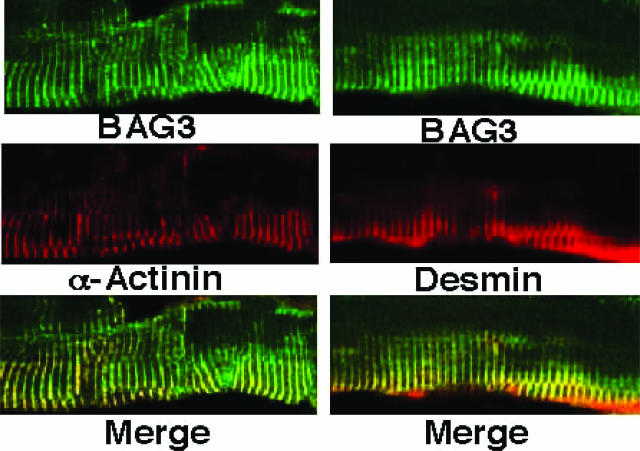
Bcl-2-associated athanogene 3 (BAG3) is a member of a conserved family of cyto-protective proteins that bind to and regulate Hsp70 family molecular chaperones. Here, we show that BAG3 is prominently expressed in striated muscle and colocalizes with Z-disks. Mice with homozygous disruption of the bag3 gene developed normally but deteriorated postnatally with stunted growth evident by 1 to 2 weeks of age and death by 4 weeks. BAG3-deficient animals developed a fulminant myopathy characterized by noninflammatory myofibrillar degeneration with apoptotic features. Knockdown of bag3 expression in cultured C2C12 myoblasts increased apoptosis on induction of differentiation, suggesting a need for bag3 for maintenance of myotube survival and confirming a cell autonomous role for bag3 in muscle. We conclude that although BAG3 is not required for muscle development, this co-chaperone appears to be critically important for maintenance of mature skeletal muscle.


Figures

Figure 1
Figure 1
bag3 is highly expressed in muscle. A: Analysis of bag3 mRNA. Human bag3 mature transcript of ∼2.8 kb and a pre-mRNA of ∼4.5-kb transcript were detectable in muscle, heart, kidney, lung, liver, and placenta (top). The blot was hybridized with a β-actin cDNA probe as a control (bottom), detecting the ∼2.4-kb β-actin transcript, which was present at similar levels in most tissues, as well as detecting ∼2.0-kb α-actin mRNA(*) in heart and skeletal muscle, which was abundantly expressed only in muscle tissues. B: Immunoblot analysis was performed using lysates from 4-week-old male mice, normalized for total protein (20 μg/lane). An ∼80-kd band, corresponding to BAG3, was detected in tissues. Anti-actin antibody was used to verify specimen integrity (bottom). C: Analysis of bag3−/− mice. Top, Southern blot analysis of genomic DNA was performed using 10 μg of PvuII-digested tail DNA from wild-type (+/+), heterozygous (+/−), and homozygous (−/−) mutant mice. Middle, PCR analysis was also performed using primers that amplify either the intact exon 3 region of the mouse bag3 gene or the Neo gene of the inserted viral vector. Bottom, immunoblot analysis of muscle tissue (25 μg/lane) detects 80-kd mouse BAG3 protein in wild-type (+/+) and heterozygous (+/−) mice but not in homozygous (−/−) mice. The lower molecular weight species are presumably partial degradation products of BAG3. D: Immunoblot analysis was performed for bag3−/− and bag3+/+ mice using tissue lysates normalized for total protein content (20 μg/lane). Blots were probed with antibodies specific for BAG3, BAG1, HSC70, and actin. Data are representative of three or more experiments (also see Supplemental Figure S1).
Figure 2
Figure 2
Comparison of BAG3-deficient mice. A: Female heterozygous (+/−) (top) and homozygous bag3-null (−/−) (bottom) littermates are shown at 22 days of age. Photographs were taken under anesthesia to control activity of mice. B: A close-up view of a 22-day-old BAG3-deficient mouse is shown, demonstrating the limb muscle wasting and expanded rib-cage. C: Growth curves are compared for bag3+/+, bag3+/−, and bag3−/− mice. Body weight was measured daily beginning at birth for wild-type (+/+) (n = 46; square), heterozygous (n = 95; +/−) (triangle), and homogyzous (−/−) (n = 36; circle) bag3 mice. No difference was detected between (+/+) and (+/−) mice. Data represent mean weight. SD was <15% each.
Figure 3
Figure 3
Histological analysis of muscle in BAG3-deficient mice. A: Comparison of histological features of myopathy in BAG3-deficient mice and mdx mice. Fresh frozen sections (8 μm) from the quadriceps muscle were evaluated from 23 bag3-null (−/−), wild-type mice (Original magnification, ×400), and mdx mice. H&E staining (top) of muscle from a bag3−/− mouse shows variability of myofiber size with numerous atrophic fibers and pyknotic nuclei. Multifocal areas of stippling and pooling of basophilic material were present within the sarcoplasm. The modified Gomori trichrome stain (middle) reveals pale myofibers in mdx muscle, indicative of necrosis, whereas bag3−/− muscle retains the normal dark staining. The cytochrome c oxidase (bottom) reaction demonstrated intact mitochondria within muscle fibers of bag3−/− mice (arrow), compared with reduced mitochondria staining in mdx mice. Scale bar = 50 μm. B: Heterogeneity in onset of muscle degeneration. At 13 days, the degree of muscle degeneration varied depending on anatomical location. Degeneration was advanced in the diaphragm (1), vastus intermedius (2), and soleus (4) muscles but minimal in the vastus lateralis (3), tibialis anterior (6), and extensor digitorum longus (5). Scale bar = 50 μm. C: Muscle inflammation and regeneration is minimal in BAG3-deficient mice. Muscle sections from bag3−/− mouse and mdx dystrophic mouse were stained with antibodies to CD45 (top) and to developmental MHC (MHCd) (bottom) by indirect immunofluorescence. Only a few positively stained cells were observed in muscle fibers from the bag3−/− mouse, indicating a paucity of both inflammatory cell infiltration and regeneration, whereas staining of mdx muscle showed extensive inflammation as well as regeneration. Phalloidin-rhodamine (red) was used for visualization of myofibers (also see Supplemental Figures S2 to S4). Scale bar = 50 μm.
Figure 4
Figure 4
Apoptotic degeneration of muscle in BAG3-deficient mice. A: Sections of soleus muscle and cardiac tissue were prepared from 22-day bag3−/− (a, c, and e) and bag3+/− (b, d, and f) mice (original magnification, ×400). Tissue sections were stained by the TUNEL method. Nuclei were lightly counterstained with Methyl Green. Many myofibers had brown TUNEL-positive nuclei in the soleus muscle of a bag3−/− mouse (a), whereas few are found in bag3+/− mice (b). TUNEL-stained sections from atrium (c and d) and ventricle (e and f) are shown revealing increased frequency of TUNEL-positive cells in bag3−/− compared with bag3+/− mice, especially in the atrium. B: Quantification of TUNEL data. The percentages of TUNEL-positive nuclei were counted in tissue sections from muscle (soleus), heart atrium, and heart ventricle of 14-day bag3−/− (black bars) and bag3+/+ (white bars) mice. Data represent mean ± SEM (n = 4). C and D: Tissue sections of quadriceps muscle were prepared from 14-day bag3−/− mice and then stained with anti-laminin antibody to detect basal lamina (C) or with anti-α sarcoglycan antibody to detect sarcolemmal membrane (D). Confocal laser scanning microscopy was performed at original magnification of ×630. TUNEL (red) staining shows apoptotic nuclei localized under the basal lamina or sarcolemmal membrane. Scale bar = 5 μm.
Figure 5
Figure 5
Z-disk alterations, degenerated myofibrils, and apoptotic nuclei in muscle of bag3−/− mice. Muscle was analyzed by transmission electron microscopy. A: Diaphragm from bag3−/− mice at E18.5, P4, and P14 (original magnification, ×11,000). E18.5 diaphragm showed no abnormalities. By postnatal day 4, Z-disk streaming and disorganization of myofibrils were observed, but apoptosis was not present. By day 14, muscle degeneration was present, with numerous pyknotic nuclei. Data are representative of two mice evaluated at each age. B: A shrunken nucleus is demonstrated with disintegration of nuclear DNA into apoptotic bodies (dark arrow) along with nuclei showing marked condensation and margination of chromatin (light arrow), consistent with early apoptotic changes in 14-day bag3−/− mouse (original magnification, ×6875). C: A focus of myofibrillar disorganization at 14 days is shown with fragments of thick and thin filaments, Z-disk remnants, myeloid structures, and accumulation of membranous material with intact but apparently fragmented (small) mitochondria (original magnification, ×6875). Similar findings were made for soleus muscle at 14 days of age (not shown). See Supplemental Figure S5 for more EM images.
Figure 6
Figure 6
BAG3 colocalizes with desmin and α-actinin in muscle tissue. BAG3 localizes with Z-disk proteins (original magnification, ×600 oil emersion). Longitudinal sections of extensor digitorum longus muscle from a wild-type mouse were used for immunofluorescence analysis with anti-BAG3 polyclonal (green) and anti-desmin (red) or anti-α-actinin (red) monoclonal antibodies. BAG3 (top), desmin or α-actinin (middle) and merged image (bottom). See Supplemental Figure S6 for control immunostaining data.
Figure 7
Figure 7
shRNA-mediated knockdown of BAG3 protein increases apoptosis and reduces accumulation of differentiated C2C12 cells. A: Western blot analysis of BAG3 indicates specific reduction of protein expression in shRNA-treated C2C12 cells. After 24 hours of infection, 20 μg of protein samples was subjected to SDS-polyacrylamide gel electrophoresis, followed by Western blot analysis using anti-BAG3 (top) and anti-β-actin (bottom) antibodies (see Supplemental Figure S7). B: Increased apoptosis in differentiating C2C12 cell cultures treated with BAG3 shRNA. C2C12 at confluency of 80 to 90% were switched to 2% horse serum to induce differentiation. The percentage of apoptotic nuclei were counted at various times by DAPI staining (mean ± SD; n = 3) over high-power fields. Asterisks denote statistically significant data (P ≤ 0.05). C: bag3 knockdown decreases the abundance of differentiated myotubes. The percentage of multinucleated cells (cells with two to four nuclei or five or more nuclei) among desmin-positive cells was measured at 3 and 5 days of differentiation (mean ± SD; n = 3) (solid bar, shRNA; hatched bar, control). The Student’s t-test was used to determine statistical significance (P < 0.05). D: bag3 knockdown reduces accumulation of differentiated C2C12 cells. At 7 days after shifting to low serum, cells were fixed with 2.5% glutaraldehyde and analyzed by immunostaining with MHC (fast type) and DAPI counterstaining. ***P = <0.05; **P = <0.01; * P = <0.001.

References

    1. Takayama S, Bimston DN, Matsuzawa S, Freeman BC, Aime-Sempe C, Xie Z, Morimoto RJ, Reed JC. BAG-1 modulates the chaperone activity of Hsp70/Hsc70. EMBO J. 1997;16:4887–4896. - PMC - PubMed
    1. Takayama S, Xie Z, Reed J. An evolutionarily conserved family of Hsp70/Hsc70 molecular chaperone regulators. J Biol Chem. 1999;274:781–786. - PubMed
    1. Takayama S, Reed JC. Molecular chaperone targeting and regulation by BAG family proteins. Nature Cell Biol. 2001;3:E237–E241. - PubMed
    1. Takayama S, Sato T, Krajewski S, Kochel K, Irie S, Millan JA, Reed JC. Cloning and functional analysis of BAG-1: a novel Bcl-2 binding protein with anti-cell death activity. Cell. 1995;80:279–284. - PubMed
    1. Lee MY, Kim SY, Shin SL, Choi YS, Lee JH, Tsujimoto Y. Reactive astrocytes express bis, a bcl-2-binding protein, after transient forebrain ischemia. Exp Neurol. 2002;175:338–346. - PubMed

Publication types

MeSH terms

Substances