Comparative Study
. 2006 Sep;169(3):831-45.
doi: 10.2353/ajpath.2006.051237.

Decreased expression of Bmi1 is closely associated with cellular senescence in small bile ducts in primary biliary cirrhosis

Affiliations
Comparative Study

Decreased expression of Bmi1 is closely associated with cellular senescence in small bile ducts in primary biliary cirrhosis

Motoko Sasaki et al. Am J Pathol. 2006 Sep.

Abstract

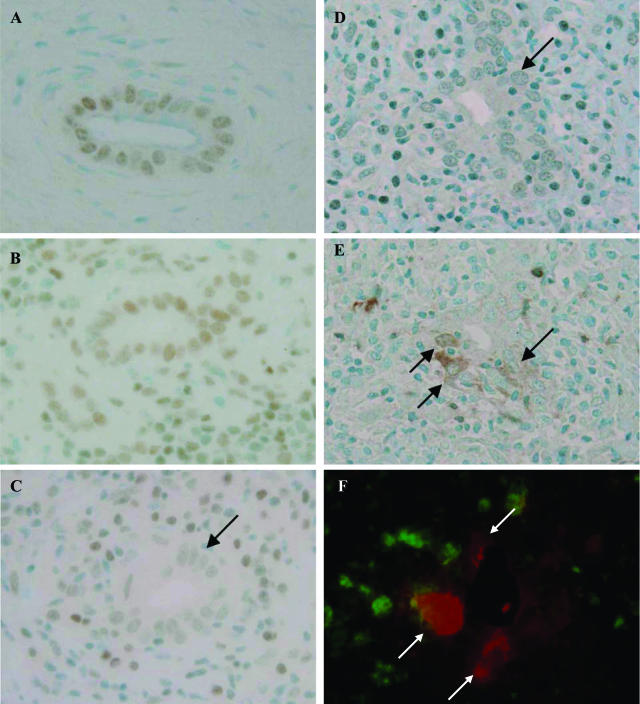
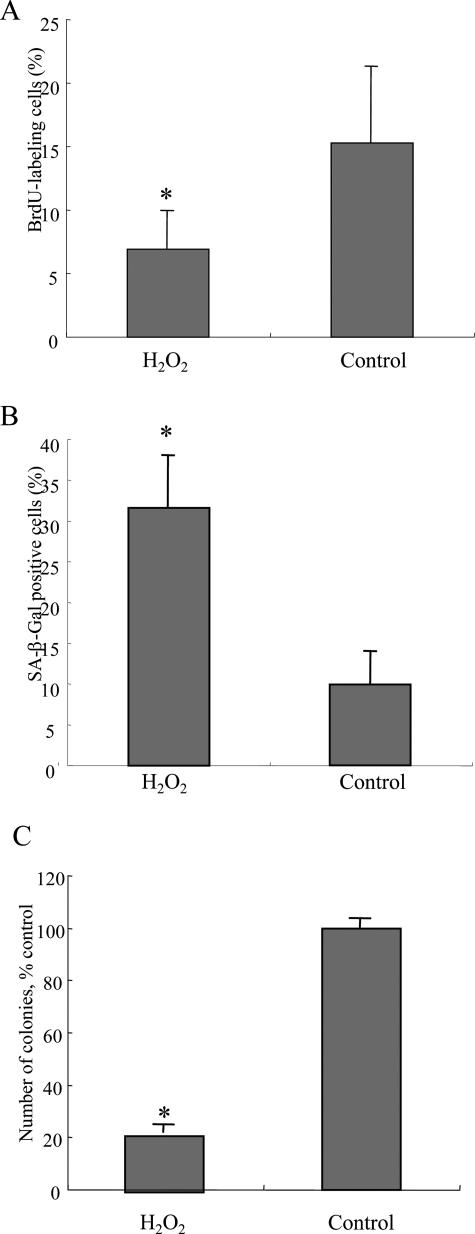
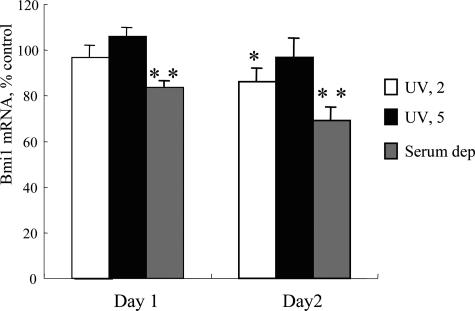
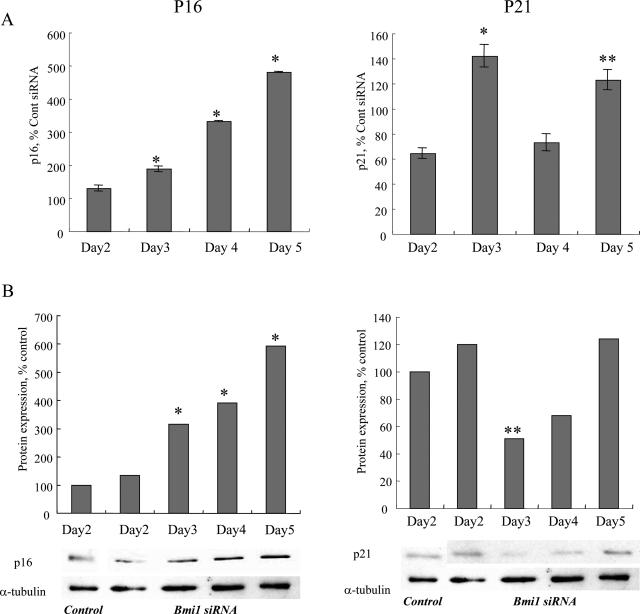
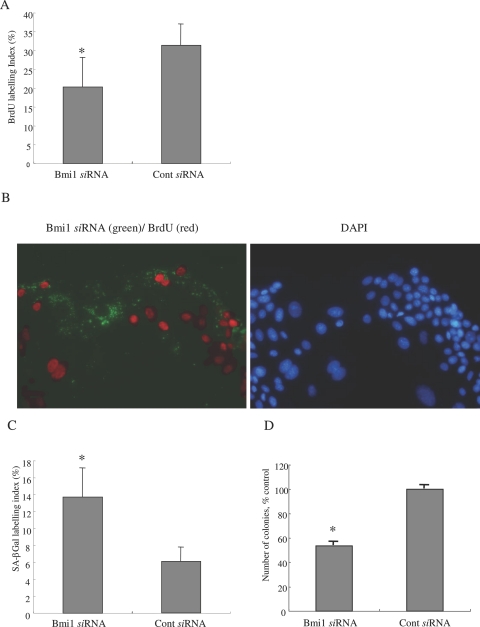
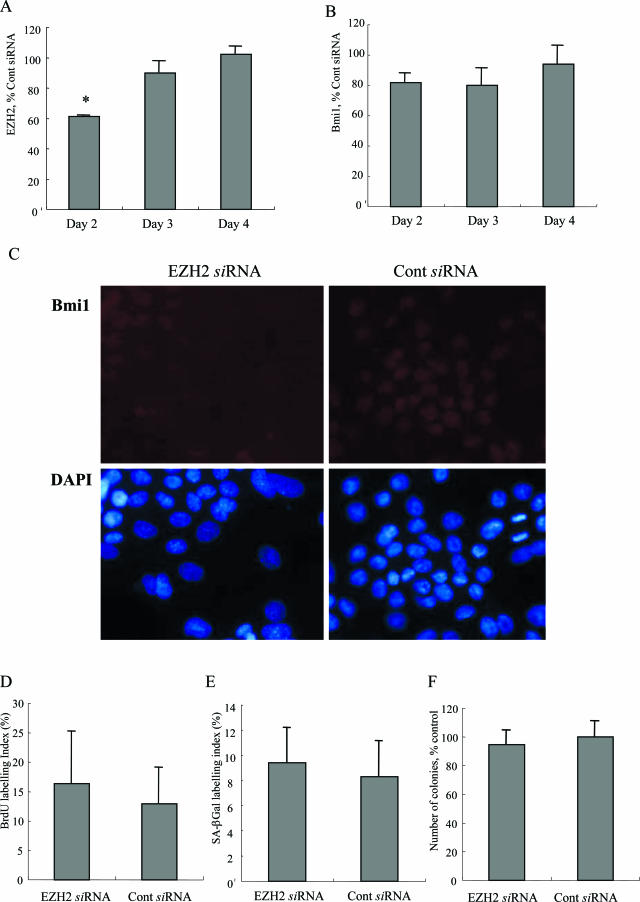
Cellular senescence of biliary epithelial cells with p16INK4a and p21WAF1/Cip expression in damaged small bile ducts may be critical for progressive bile duct loss in primary biliary cirrhosis. We investigated the involvement of bmi1, a polycomb group gene repressing p16INK4a expression, in the pathogenesis of biliary cellular senescence. Bmi1 expression was examined immunohistochemically in livers taken from the patients with primary biliary cirrhosis (n=18) and other diseased (n=19) and normal livers (n=16). We examined the effect of oxidative stress and a short interference RNA (siRNA) targeting bmi1 on cellular senescence in cultured mouse biliary epithelial cells. Bmi1 was widely expressed in the nuclei of biliary epithelial cells in the control livers. In contrast, bmi1 expression was significantly decreased in damaged small bile ducts in 43% of livers with primary biliary cirrhosis of stage 1/2, coordinating with the increased p16INK4a expression. In cultured biliary epithelial cells, oxidative stress by H2O2 treatment significantly decreased bmi1 expression, followed by increased P16INK4a expression. A knockdown of bmi1 induced increased p16INK4a expression, decreased cell proliferation, and increased cellular senescence. In conclusion, the decreased bmi1 expression caused by oxidative stress may be involved in the pathogenesis of cellular senescence of biliary epithelial cells in primary biliary cirrhosis.


Figures

Figure 1
Figure 1
Decreased expression of bmi1 and its relation with p16INK4a expression in BECs at the site of chronic nonsuppurative destructive cholangitis in PBC. A and B: bmi1 was expressed in the nuclei of BECs in normal livers (A) and CVH livers (B). C: The expression of bmi1 was decreased (arrows) in BECs at the site of chronic nonsuppurative destructive cholangitis. PBC, stage 2. D and E: Correlated expression of bmi1 (D) and p16INK4a (E) as a senescence-associated marker. The expression of bmi1 was decreased in BECs in the small bile ducts involved in chronic nonsuppurative destructive cholangitis (D, arrow), and the expression of p16INK4a was increased in BECs in the same damaged small bile duct (E, arrow). PBC, stage 2. Immunostaining for bmi1 (A–D) and p16INK4a (E). F: Dual immunostaining of bmi1 (green fluorescence) and p16INK4a (red fluorescence) demonstrated the absence of bmi1 expression in nuclei of BECs expressing p16INK4a (arrows). Original magnifications, ×400.
Figure 2
Figure 2
The effect of oxidative stress on bmi1, p16INK4a, and p21WAF1/Cip expression in BECs. A: bmi1 mRNA expression was significantly lower in BECs on days 2, 3, and 4 after H2O2 (112.5 μmol/L, 2 hours) treatment. P16INK4a mRNA expression was increased significantly on days 3, 4, and 5 after H2O2 treatment. P21WAF1/Cip mRNA expression was high on day 1, gradually decreased on days 2, 3, and 4 after H2O2 treatment. Expression of mRNA was quantified with real-time PCR. The expression was normalized as a ratio using GAPDH as a housekeeping gene. Data are expressed as the mean ± SD. *P < 0.01, **P < 0.05 compared to the control, n = 3 for each group. B: Immunoblot analysis for bmi1, p16INK4a, and p21WAF1/Cip protein expression in BECs treated with H2O2 (112.5 μmol/L, 2 hours) and control BECs. A pool of protein samples prepared in three independent experiments was used and analysis was performed twice. C: Intensity of each band in immunoblot analysis (B) was quantified by densitometry, normalized as a ratio using α-tubulin as an internal control, and statistically analyzed. Bmi1 protein expression was significantly lower in BECs on days 3, 4, and 5 after H2O2 treatment. P16INK4a protein expression was significantly high after H2O2 treatment. P21WAF1/Cip protein expression was high on day 2 after H2O2 treatment and normalized thereafter. *P < 0.01, **P < 0.05 compared to control.
Figure 3
Figure 3
Oxidative stress inhibits cell proliferation and induces cellular senescence. A: Cell proliferation was assessed by 5-bromo-2′-deoxyuridine (BrdU) assay on day 4 after H2O2 treatment. The labeling index of BrdU was counted for at least 1000 cells in each group. The labeling index of BrdU was significantly low in BECs treated with H2O2 (112.5 μmol/L, 2 hours), when compared with control BECs. Data are expressed as the mean ± SD. *P < 0.01 compared to control. B: Cellular senescence was assessed by senescence-associated β-galactosidase activity (SA-β-gal) on day 6 after H2O2 treatment. Percentage of cells positive for SA-β-Gal activity was significantly higher in BECs treated with H2O2 (112.5 μmol/L, 2 hours), when compared with the control BECs. Data are expressed as the mean ± SD. *P < 0.01 compared to the control. C: Cellular senescence was assessed by colony-forming assay on day 6 after H2O2 treatment. Number of colonies was significantly lower in BECs treated with H2O2 (112.5 μmol/L, 2 hours), when compared with the control BECs. Data are expressed as the mean ± SD. *P < 0.01 compared to the control.
Figure 4
Figure 4
The effect of UV irradiation and serum deprivation on bmi1 expression in BECs. bmi1 mRNA expression was significantly lower in BECs on days 1 and 2 after serum deprivation and on day 1 after UV irradiation (2 J/m2). bmi1 mRNA was quantified with real-time PCR and the expression was normalized as a ratio using GAPDH as a housekeeping gene. Data are expressed as the mean ± SD. *P < 0.01, **P < 0.05 compared to the control, n = 3 for each group. Serum dep., serum deprivation.
Figure 5
Figure 5
Validation of siRNA targeting bmi1. A: bmi1 mRNA expression was significantly lower in BECs transfected with siRNA targeting bmi1 on days 2, 3, and 4. bmi1 mRNA was quantified with real-time PCR. The expression was normalized as a ratio using GAPDH as a housekeeping gene. Data are expressed as the mean ± SD. *P < 0.01, **P < 0.05 compared to the control, n = 3 for each group. B: Immunoblot analysis for bmi1 protein expression in BECs transfected with siRNA targeting bmi1 and a control siRNA. Day 3 after transfection. Three independent experiments showed similar results. C: bmi1 expression labeled by red fluorescence was suppressed in the cells transfected with bmi1 siRNA showing green fluorescence in the cytoplasm (arrows) (left). In contrast, bmi1 expression was not decreased in the cells transfected with control siRNA (right). Day 3 after transfection.
Figure 6
Figure 6
The effect of bmi1 knockdown on p16INK4a and p21WAF1/Cip expression. A: P16INK4a mRNA expression was significantly higher in BECs transfected with siRNA targeting bmi1 on days 3, 4, and 5 (left). P21WAF1/Cip mRNA was significantly higher on days 3 and 5 after siRNA transfection. P16INK4a and p21WAF1/Cip mRNA was quantified with real-time PCR. The expression was normalized as a ratio using GAPDH as a housekeeping gene and was shown as percentage of control. Data are expressed as the mean ± SD. *P < 0.01, **P < 0.05 compared to the control, n = 3 for each group. B: Immunoblot for p16INK4a and p21WAF1/Cip protein expression in BECs transfected with siRNA targeting bmi1 and a control siRNA. The intensity of each band in immunoblot analysis was quantified by densitometry, normalized as a ratio using α-tubulin as an internal control and statistically analyzed. P16INK4a protein expression was significantly higher in BECs on days 3, 4, and 5 after bmi1 siRNA transfection (left). P21WAF1/Cip protein expression was low on day 3 after siRNA transfection. *P < 0.01, **P < 0.05 compared to the control. Three independent experiments showed similar results.
Figure 7
Figure 7
The knockdown of bmi1 inhibits cell proliferation and induces cellular senescence. A: Cell proliferation was assessed by 5-bromo-2′-deoxyuridine (BrdU) assay. The labeling index of BrdU was counted for at least 1000 cells in each group. The labeling index of BrdU was significantly low in BECs transfected with bmi1 siRNA, when compared with BECs transfected with control siRNA. Data are expressed as the mean ± SD. *P < 0.01. Day 4 after transfection. B: Most BECs transfected with bmi1 siRNA showing green fluorescence in cytoplasm were negative for BrdU-labeling (red fluorescence). C: Cellular senescence was assessed by the senescence-associated β-galactosidase activity (SA-β-gal). Percentage of cells for positive for SA-β-Gal activity was significantly higher in BECs transfected with bmi1 siRNA, when compared with BECs transfected with control siRNA. Data are expressed as the mean ± SD. *P < 0.01. Day 6 after transfection. D: Number of colonies was significantly lower in BECs transfected with bmi1 siRNA, when compared with BECs transfected with control siRNA. Data are expressed as the mean ± SD. *P < 0.01. Day 6 after transfection.
Figure 8
Figure 8
The effect of oxidative stress, UV irradiation, and serum deprivation on EZH2 expression in BECs. A: EZH2 mRNA expression was significantly lower in BECs on day 4 after H2O2 (112.5 μmol/L, 2 hours) treatment. B: EZH2 mRNA expression was significantly lower in BECs on days 1 and 2 after serum deprivation and on day 2 after UV irradiation (5 J/m2). A and B: EZH2 mRNA was quantified with real-time PCR and the expression was normalized as a ratio using GAPDH as a housekeeping gene. Data are expressed as the mean ± SD. *P < 0.01 compared to the control, n = 3 for each group. Serum dep, serum deprivation.
Figure 9
Figure 9
The knockdown of EZH2 slightly decreases the nuclear expression of bmi1 but does not affect cell proliferation and cellular senescence. A: EZH2 mRNA expression was significantly lower in BECs transfected with siRNA targeting EZH2 on day 2. EZH2 mRNA was quantified with real-time PCR. The expression was normalized as a ratio using GAPDH as a housekeeping gene. Data are expressed as the mean ± SD. *P < 0.01 compared to the control, n = 3 for each group. B: bmi1 mRNA expression was slightly lower in BECs transfected with siRNA targeting EZH2 on days 2, 3, and 4, but there was no statistical difference. bmi1 mRNA was quantified with real-time PCR. The expression was normalized as a ratio using GAPDH as a housekeeping gene. Data are expressed as the mean ± SD. C: The nuclear expression of bmi1 labeled by red fluorescence was decreased in the cells transfected with EZH2 siRNA (left), when compared with the cells transfected with control siRNA (right). Day 4 after transfection. D: The labeling index of BrdU was not significantly different in BECs transfected with EZH2 siRNA (16.3 ± 8.8%), when compared with BECs transfected with control siRNA (12.9 ± 6.0%). Data are expressed as the mean ± SD. The labeling index of BrdU was counted for at least 1000 cells in each group. Day 4 after transfection. E: Percentage of cells positive for SA-β-Gal activity was not significantly different in BECs transfected with EZH2 siRNA, when compared with BECs transfected with control siRNA. Data are expressed as the mean ± SD. Day 6 after transfection. F: Number of colonies was not significantly different in BECs transfected with EZH2 siRNA, when compared with BECs transfected with control siRNA. Data are expressed as the mean ± SD. Day 6 after transfection.

Similar articles

Cited by

References

    1. Gershwin ME, Mackay IR, Sturgess A, Coppel RL. Identification and specificity of a cDNA encoding the 70 kd mitochondrial antigen recognized in primary biliary cirrhosis. J Immunol. 1987;138:3525–3531. - PubMed
    1. Kaplan M. Primary biliary cirrhosis. N Engl J Med. 1996;335:1570–1580. - PubMed
    1. Portmann B, Nakanuma Y. MacSween R, Burt A, Portmann B, Ishak K, Scheuer P, Anthony P, editors. London: Churchill Livingstone,; Diseases of the bile ducts. Pathology of the Liver, (ed 4) 2001:pp 435–506.
    1. Nakanuma Y, Ohta G. Histometric and serial section observations of the intrahepatic bile ducts in primary biliary cirrhosis. Gastroenterology. 1979;76:1326–1332. - PubMed
    1. Fussey S, Guest J, James O, Bassendine M, Yeaman S. Identification and analysis of the major M2 autoantigens in primary biliary cirrhosis. Proc Natl Acad Sci USA. 1988;85:8654–8658. - PMC - PubMed

Publication types

MeSH terms

LinkOut - more resources