Comparative Study
. 2006 Sep;169(3):877-88.
doi: 10.2353/ajpath.2006.050464.

Estrogens and insulin-like growth factor 1 modulate neoplastic cell growth in human cholangiocarcinoma

Affiliations
Comparative Study

Estrogens and insulin-like growth factor 1 modulate neoplastic cell growth in human cholangiocarcinoma

Domenico Alvaro et al. Am J Pathol. 2006 Sep.

Abstract

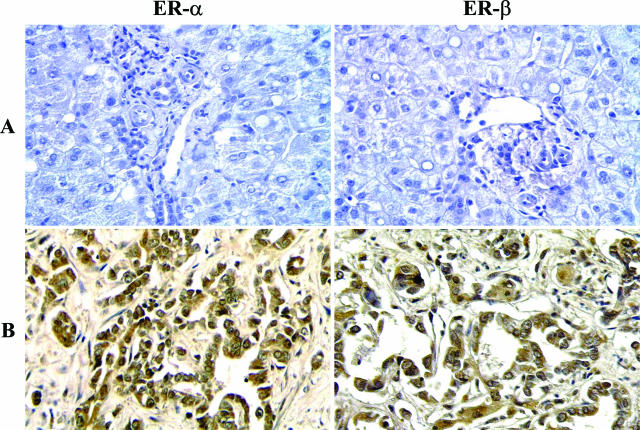
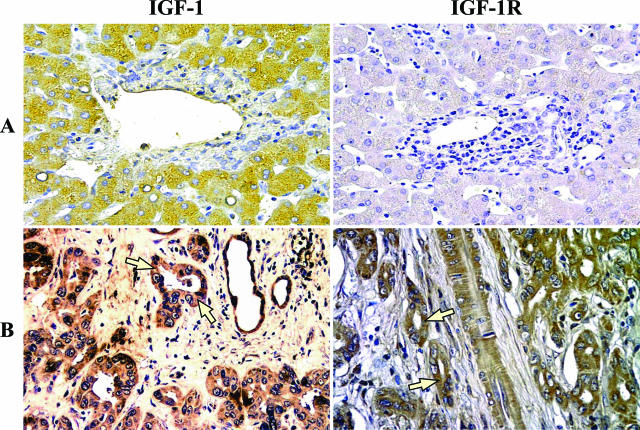
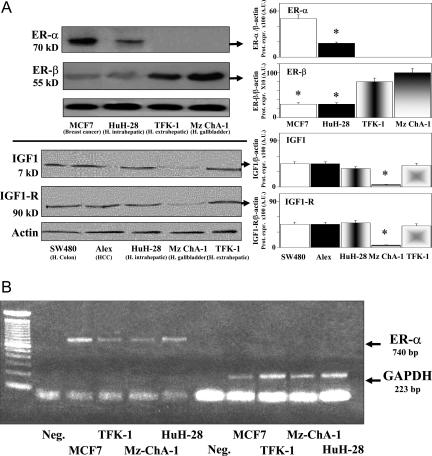
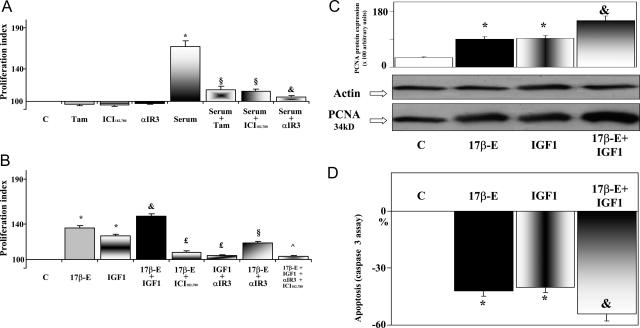
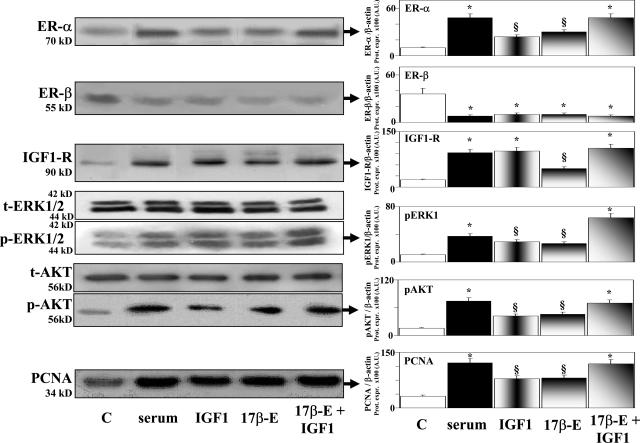
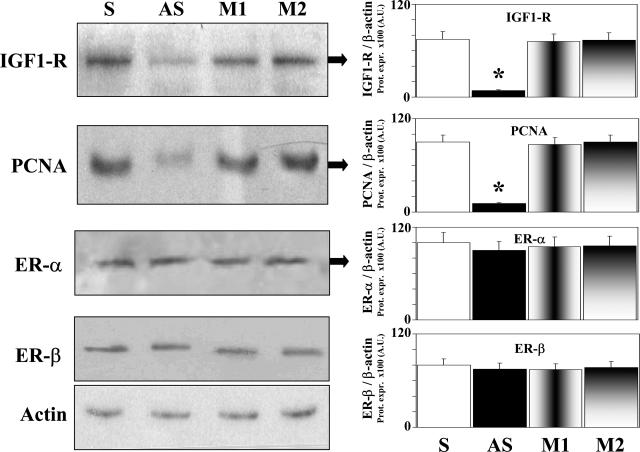
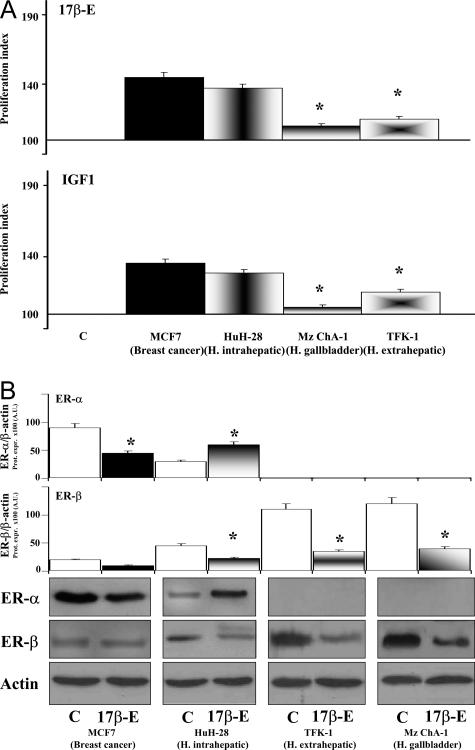
We investigated the expression of estrogen receptors (ERs), insulin-like growth factor 1 (IGF-1), and IGF-1R (receptor) in human cholangiocarcinoma and cholangiocarcinoma cell lines (HuH-28, TFK-1, Mz-ChA-1), evaluating the role of estrogens and IGF-1 in the modulation of neoplastic cell growth. ER-alpha, ER-beta, IGF-1, and IGF-1R were expressed (immunohistochemistry) in all biopsies (18 of 18) of intrahepatic cholangiocarcinoma. ER-alpha was expressed (Western blot) only by the HuH-28 cell line (intrahepatic cholangiocarcinoma), whereas ER-beta, IGF-1, and IGF-1R were expressed in the three cell lines examined. In serum-deprived HuH-28 cells, serum readmission induced stimulation of cell proliferation that was inhibited by ER and IGF-1R antagonists. 17beta-Estradiol and IGF-1 stimulated proliferation of HuH-28 cells to a similar extent to that of MCF7 (breast cancer) but greater than that of TFK-1 and Mz-ChA-1, inhibiting apoptosis and exerting additive effects. These effects of 17beta-estradiol and IGF-1 were associated with enhanced protein expression of ER-alpha, phosphorylated (p)-ERK1/2 and pAKT but with decreased expression of ER-beta. Finally, transfection of IGF-1R anti-sense oligonucleotides in HuH-28 cells markedly decreased cell proliferation. In conclusion, human intrahepatic cholangiocarcinomas express receptors for estrogens and IGF-1, which cooperate in the modulation of cell growth and apoptosis. Modulation of ER and IGF-1R could represent a strategy for the management of cholangiocarcinoma.


Figures

Figure 1
Figure 1
Immunohistochemistry for ER-α and ER-β in human normal liver and cholangiocarcinoma. A: Intrahepatic bile ducts of the normal liver were negative at immunohistochemical analysis for ER-α (left) and ER-β (right). B: Biopsies of human cholangiocarcinoma showing an intense positivity for both ER-α (left) and ER-β (right) involving both the cytoplasm and nucleus. Light microscopy. Original magnifications, ×20.
Figure 2
Figure 2
Immunohistochemistry for IGF-1 and IGF-1R in human normal liver and cholangiocarcinoma. A: Intrahepatic bile ducts of the normal liver were negative at immunohistochemical analysis for IGF-1 (left) and IGF-1R (right). B: Biopsies of human cholangiocarcinoma showing an intense positivity for both IGF-1 and IGF-1R at cytoplasmatic level (arrows). Light microscopy. Original magnifications, ×20.
Figure 3
Figure 3
A: Western blot analysis of ER, IGF-1, and IGF-1R in human cholangiocarcinoma cell lines. Cell lines, maintained in the appropriate culture medium (see Materials and Methods) with 10% fetal bovine serum, were solubilized in lysis buffer, and then the cell extract was resolved by 10% SDS-PAGE. The protein mass was determined by evaluating the intensity of the bands by scanning video densitometry and expressed (Prot. Expr.) as arbitrary densitometric units (A.U.) normalized to β-actin expression (ie, tested protein/β-actin × 100). Top: ER-α was expressed by the HuH-28 (intrahepatic) cholangiocarcinoma cell line and by the MCF7 breast cancer cell line (positive control) but not by the TFK-1 (human extrahepatic) and Mz-ChA-1 (human gallbladder) cell lines. ER-β was similarly expressed in HuH-28 (intrahepatic) and in MCF7 breast cancer (positive control) cell lines but markedly higher expressed in both TFK-1 (human extrahepatic) and Mz-ChA-1 (human gallbladder) cell lines. *P < 0.05 versus the other cell lines; five independent experiments. Bottom: IGF-1 and IGF-1R protein expression was similar in HuH-28 (intrahepatic) and TFK-1 (human extrahepatic) cholangiocarcinoma cell lines without significant differences with respect to cell lines derived from human hepatocellular carcinoma (Alex) or human colon carcinoma (SW480) used as positive controls. In contrast, the MZ-ChA-1 cell line showed a protein mass of IGF-1 and IGF-1R significantly lower than all of the other cell lines investigated. *P < 0.01 versus the other cell lines; five independent experiments. B: RT-PCR analysis of ER-α in different cell lines. Total cellular RNA was extracted from different cells lines and used (1 μg) for first strand cDNA synthesis by AMV reverse transcriptase. PCR primers for ER-α were based on the published sequence. GAPDH was used as a housekeeping gene. Neg., negative control. The figure is representative of three independent experiments with similar findings.
Figure 4
Figure 4
Effects of serum, 17β-estradiol, IGF-1, and receptor antagonists on proliferation index, PCNA protein expression, and apoptosis of HuH-28 cell line. HuH-28 cells cultured in CRML 1066 medium containing 10% fetal bovine serum were deprived of serum for 48 hours. Then the cells were maintained in serum-deprived conditions for further 48 hours (controls, C) or exposed to serum, 17β-estradiol, IGF-1, and/or receptor antagonists for a further 48 hours. Proliferation index, protein expression of PCNA, and apoptosis were determined. A: Effect of serum readmission on proliferation index of HuH-28 cell line in the presence or absence of ER and IGF-1R antagonists. HuH-28 cells deprived of serum for 48 hours were maintained under serum-deprived conditions for a further 48 hours (controls, C) or exposed (48 hours) to serum in the presence or absence of the ER antagonists, tamoxifen (Tam, 1 μmol/L) and ICI 182,780 (1 μmol/L), or the IGF-1R blocking antibody αIR3 (1 μg/ml), which were added into the culture medium. Proliferation index was calculated as the ratio (multiplied × 100) between cell number (MTS assay) in stimulated and unstimulated (control) cultures. *P < 0.01 versus controls; §P < 0.01 versus serum; &P < 0.05 versus serum plus Tam or serum plus ICI 182,780. Ten independent experiments for each protocol. B: Effect of 17β-estradiol, IGF-1 and antagonists of ER and IGF-1R on proliferation index of HuH-28 cell line. HuH-28 cells deprived of serum for 48 hours were maintained under serum-deprived conditions for further 48 hours (controls, C) or exposed (48 hours) to 17β-estradiol (17β-E, 10 nmol/L), IGF-1 (10 ng/ml, 1.3 nmol/L), the ER antagonist, ICI 182,780 (1 μmol/L), or the IGF-1R blocking antibody, αIR3 (1 μg/ml) that were added into the culture medium. *P < 0.01 versus C; &P < 0.05 versus 17β-E or IGF-1; £P < 0.01 versus 17β-E and IGF-1, respectively; §P < 0.01 versus 17β-E; ^ P < 0.01 versus 17β-E and IGF-1. Ten independent experiments for each protocol. C: Western blot analysis of PCNA (proliferation marker) in HuH-28 cell lines exposed to 17β-estradiol and IGF-1. HuH-28 cells deprived of serum for 48 hours were maintained under serum-deprived conditions for an additional 48 hours (controls, C) or exposed (48 hours) to 17β-estradiol (17β-E, 10 nmol/L), IGF-1 10 ng/ml (1.3 nmol/L), or 17β-estradiol and IGF-1, which were added into culture medium. For Western blot analysis, cells were solubilized in lysis buffer and then resolved by 10% SDS-PAGE. The protein mass was determined by evaluating the intensity of the bands by scanning video densitometry and expressed (Prot. Expr.) as arbitrary densitometric units (A.U.) normalized to β-actin expression (ie, tested protein/β-actin × 100). *P < 0.01 versus controls (C); &P < 0.05 versus 17β-estradiol or IGF-1 alone. Six independent experiments for each protocol. D: Effect of 17β-estradiol and IGF-1 on apoptosis (caspase 3 assay) of HuH-28 cell lines. HuH-28 cells deprived of serum for 48 hours, were maintained under serum-deprived conditions for an additional 48 hours (controls, C) or exposed (48 hours) to 17β-estradiol (17β-E, 10 nmol/L), IGF-1 (10 ng/ml, 1.3 nmol/L), or 17β-estradiol and IGF-1 added into the culture medium. Apoptosis was evaluated by measuring caspase 3 activity from the hydrolysis of Ac-DEVD-pNA with release of the pNA. Caspase 3 activity resulting from the measured concentration of pNA was expressed as percent changes with respect to controls. *P < 0.01 versus controls (C); &P < 0.05 versus 17β-estradiol or IGF-1 alone. Eight independent experiments were performed for each protocol.
Figure 5
Figure 5
Effect of serum, IGF-1, 17β-estradiol, and 17β-estradiol and IGF-1 on the protein expression (Western blot) of ER-α, ER-β, IGF-1R, ERK1/2, AKT, and PCNA in HuH-28 cell lines. HuH-28 cells deprived of serum for 48 hours were maintained under serum-deprived conditions for an additional 48 hours (controls, C) or exposed (48 hours) to serum, 17β-estradiol (17β-E, 10 nmol/L), IGF-1 (10 ng/ml, 1.3 nmol/L), or 17β-estradiol and IGF-1, which were added into the culture medium. For Western blot analysis, cells were solubilized in lysis buffer, and then the cell extract was resolved by 10% SDS-PAGE. The protein mass was determined by evaluating the intensity of the bands by scanning video densitometry and expressed (Prot. Expr.) as arbitrary densitometric units (A.U.) normalized to β-actin expression (ie, tested protein/β-actin × 100). *P < 0.01 versus controls (C); §P < 0.01 versus controls, P < 0.05 versus serum or 17β-estradiol and IGF-1. Ten independent experiments were performed for each protocol.
Figure 6
Figure 6
Effect of transfection of HuH-28 cells with IGF-1-R anti-sense phosphorothioate oligonucleotides on IGF-1, ER, and PCNA protein expression. One day before transfection, HuH-28 cells were plated in growth medium (10% fetal bovine serum and 0.5% antibiotics) to obtain 50% confluency at the time of transfection. Phosphorothioate oligonucleotides were transfected into cells using oligofectamine reagent (Invitrogen). Cells were washed two times with serum-free medium and then incubated with S-ODN-oligofectamine solution at 37°C in a CO2 incubator for 4 hours (serum-free medium). Then, a medium containing 30% serum and 1% antibiotics was added to the cells without removing the transfection mixture and after 2 days (30% serum) the protein expression of IGF-1R, ER, and PCNA (proliferation marker) was analyzed. For Western blot analysis, cells were solubilized in lysis buffer, and then the cell extract was resolved by 10% SDS-PAGE. The protein mass was determined by evaluating the intensity of the bands by scanning video densitometry and expressed (Prot. Expr.) as arbitrary densitometric units (A.U.) normalized to β-actin expression (ie, tested protein/β-actin × 100). *P < 0.01 versus other columns; four independent experiments. S, sense; AS, anti-sense; M1, mismatch 1; M2, mismatch 2.
Figure 7
Figure 7
Effect of 17β-estradiol and IGF-1 on the proliferation index and protein expression of ER-α and -β in different cell lines. A: Cell lines cultured in medium containing 10% fetal bovine serum were deprived of serum for 48 hours. Then cells were maintained in serum-deprived conditions for a further 48 hours (controls, C) or exposed to 17β-estradiol (10 nmol/L) or IGF-1 (10 ng/ml), which were added into the culture medium for a further 48 hours. Proliferation index was calculated as the ratio (multiplied × 100) between cell number (MTS assay) in stimulated and unstimulated (control) cultures. *P < 0.01 versus MCF7 or HuH-28. Ten independent experiments for each protocol. B: For Western blot analysis, in the same experimental conditions described for A, cells were solubilized in lysis buffer and then the cell extract was resolved by 10% SDS-PAGE. The protein mass was determined by evaluating the intensity of the bands by scanning video densitometry and expressed (Prot. Expr.) as arbitrary densitometric units (A.U.) normalized to β-actin expression (ie, tested protein/β-actin × 100). *P < 0.05 versus controls (C, empty columns). Eight independent experiments were performed for each protocol.

Similar articles

Cited by

References

    1. Gores GJ. A spotlight on cholangiocarcinoma. Gastroenterology. 2003;125:1536–1538. - PubMed
    1. Gores GJ. Cholangiocarcinoma: current concepts and insights. Hepatology. 2003;37:961–969. - PubMed
    1. Blendis L, Halpern Z. An increasing incidence of cholangio-carcinoma: why? Gastroenterology. 2004;127:1008–1009. - PubMed
    1. Migliaccio A, Castoria G, Di Domenico M, de Falco A, Bilancio A, Lombardi M, Bottero D, Varricchio L, Nanayakkara M, Rotondi A, Auricchio F. Sex steroid hormones act as growth factors. J Steroid Biochem Mol Biol. 2002;83:31–35. - PubMed
    1. Koike S, Sakai M, Muramatsu M. Molecular cloning and characterization of rat estrogen receptor. Nucleic Acids Res. 1987;15:2499–2513. - PMC - PubMed

Publication types

MeSH terms