. 2006;34(16):4375-86.
doi: 10.1093/nar/gkl558. Epub 2006 Aug 26.

Apoptosis resistance downstream of eIF4E: posttranscriptional activation of an anti-apoptotic transcript carrying a consensus hairpin structure

Affiliations

Apoptosis resistance downstream of eIF4E: posttranscriptional activation of an anti-apoptotic transcript carrying a consensus hairpin structure

Ola Larsson et al. Nucleic Acids Res. 2006.

Abstract

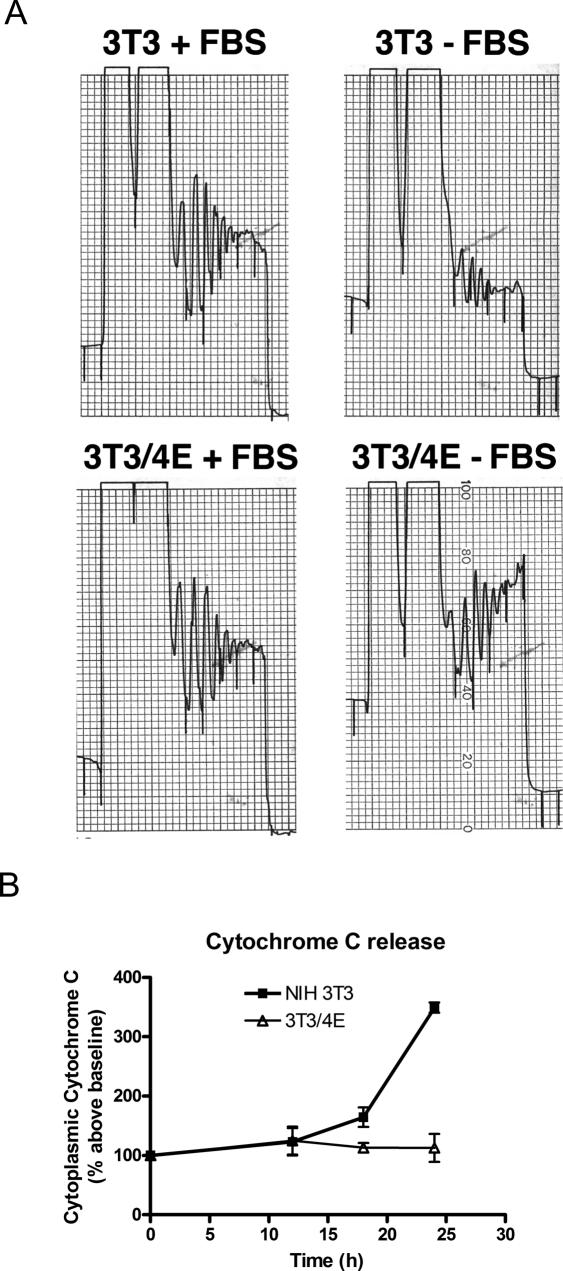
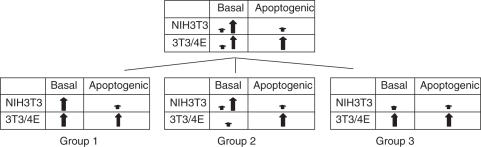
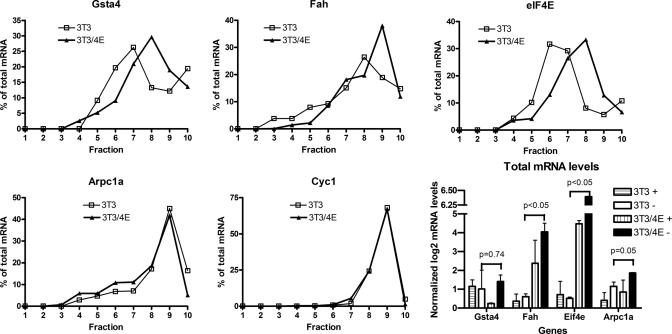
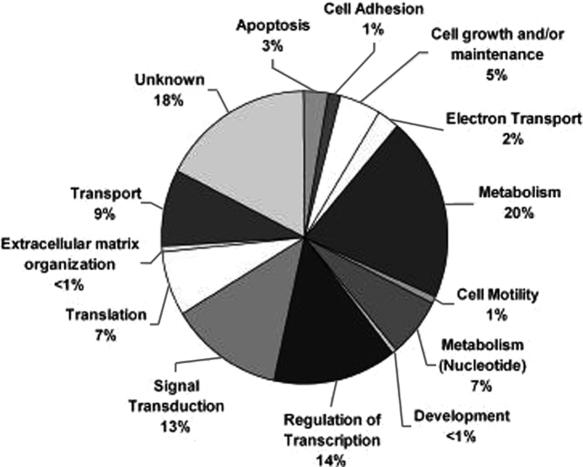
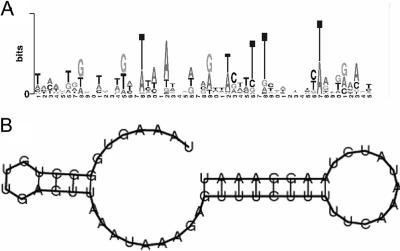
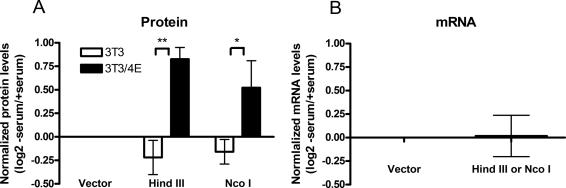
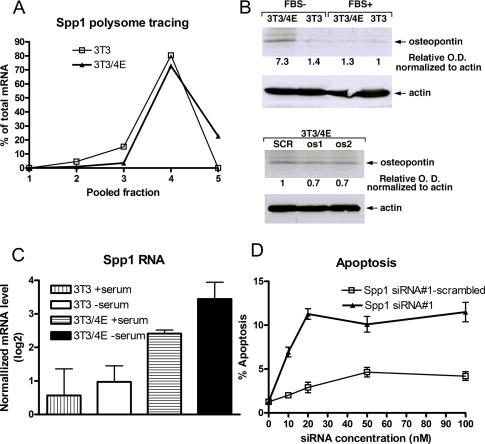
Aberrant activation of the translation initiation machinery is a common property of malignant cells, and is essential for breast carcinoma cells to manifest a malignant phenotype. How does sustained activation of the rate limiting step in protein synthesis so fundamentally alter a cell? In this report, we test the post transcriptional operon theory as a possible mechanism, employing a model system in which apoptosis resistance is conferred on NIH 3T3 cells by ectopic expression of eIF4E. We show (i) there is a set of 255 transcripts that manifest an increase in translational efficiency during eIF4E-mediated escape from apoptosis; (ii) there is a novel prototype 55 nt RNA consensus hairpin structure that is overrepresented in the 5'-untranslated region of translationally activated transcripts; (iii) the identified consensus hairpin structure is sufficient to target a reporter mRNA for translational activation under pro-apoptotic stress, but only when eIF4E is deregulated; and (iv) that osteopontin, one of the translationally activated transcripts harboring the identified consensus hairpin structure functions as one mediator of the apoptosis resistance seen in our model. Our findings offer genome-wide insights into the mechanism of eIF4E-mediated apoptosis resistance and provide a paradigm for the systematic study of posttranscriptional control in normal biology and disease.


Figures

Figure 1
Figure 1
Microarray analysis of polyribosome stratified RNA. (A) Polyribosome preparations. Polyribosome preparations were carried out as described previously (18). Shown is the optical density profile (254 nm) of a representative polyribosome preparation for NIH 3T3 and NIH 3T3/4E cells under basal and serum starved conditions. (B) Kinetics of mitochondrial release of cytochrome C in serum-starved cells NIH 3T3 and NIH 3T3/4E. Shown is the release of cytochrome c monitored by immunoassay (Quantikine M Rat/Mouse; R&D Systems) as a function of time after shift to serum-free media.
Figure 2
Figure 2
Genome-wide identification of translationally activated transcripts in NIH 3T3 cells rescued from apoptosis by eIF4E. Cells, apoptogenic conditions and procedures for polyribosome and microarray data analysis were as described in Materials and Methods, using the ‘Mouse array 15k’ from the Micro array center, Ontario Cancer Institute. Shown is a schematic representation of the three groups that resulted from the data analysis approach based on transcript abundance (i.e. signal intensity on the microarray) and statistical significance in the translationally active (heavy) fractions. To simplify presentation, transcript abundance is schematically depicted as arrows of differing sizes. A large arrow designates high abundance, a small arrow designates low abundance, and a large and small arrow together designate either high or low abundance.
Figure 3
Figure 3
Validation of translational activity. Polyribosomes from NIH 3T3 and NIH 3T3/4E cells subjected to serum withdrawal were separated into 10 size fractions. Three transcripts identified in the array analysis and two transcripts selected as negative controls were analyzed using QRT–PCR across the polyribosome gradient and total mRNA abundance of four of the genes were measured using Cyc1 as an internal control (error bars indicates standard deviations from two independent experiments).
Figure 4
Figure 4
Categorization of translationally activated genes. Genes were categorized using manually curated annotations from the Gene Ontology Consortium (). Shown are the percentages of genes from all three groups in each of the functional categories.
Figure 5
Figure 5
(A) A novel mRNA sequence element conserved in the 5′-UTR of transcripts. The sequence was found in the group in which NIH 3T3/4E-Heavy-apoptogenic/NIH 3T3-Heavy-apoptogenic > 2 and NIH 3T3/4E-Heavy-apoptogenic ≠ NIH 3T3-Heavy-apoptogenic (SAM FDR < 0.05). The element was identified by BioProspector and BioOptimizer. The figure shows the bit scores for the four nucleotides at each position of the element as a size shift of the letter symbolizing each nucleotide. (B) Structure of the consensus sequence of the 5′ 55mer by RNAfold with default parameters.
Figure 6
Figure 6
Translational activation mediated by the 55mer 5′-UTR structure. (A) Plasmids carrying the 55mer (with bases 9–10 flipped to avoid a cryptic translational start site as these positions were essentially not conserved at all across the 14 genes, Figure 5A bases 9–10) at two different positions (the HindIII positions the 55mer close to the transcription start site whereas the NcoI positions the 55mer close to the translational start site with a distance of ∼30 nt from the two sites) were transfected into NIH 3T3 and NIH 3T3/4E cells, which were serum starved or maintained in normal media. The cells were harvested after 16 h and relative protein levels were measured using the dual luciferase assay. Shown are the ratios between serum starved and serum replete cells. Each experiment was normalized to the basic vector pGL3 control and the experiment was repeated three times in duplicate (two different constructs showed similar results and were pooled). (Error bars indicate standard deviation, *students t-test P-value <0.05 and **students t-test P-value <0.001.) (B) The experiment was repeated in NIH 3T3/4E cells while measuring the mRNA level of the luciferase-gene carrying the 55mer. The data were normalized as in Figure 6A. (Error bars indicate standard deviations from three to four independent measurements, pooled from the two constructs.)
Figure 7
Figure 7
Validation of osteopontin (Spp1) as a translationally activated antagonist of apoptosis. (A) RT–PCR quantification of the osteopontin transcript across the polyribosome gradient. Adjacent polyribosome fractions were paired, and osteopontin transcript was quantified by RT–PCR. (B) Representative experiment showing osteopontin protein levels in NIH 3T3 and NIH 3T3/4E cells after 16 h serum starvation (upper panel); and osteopontin levels in NIH 3T3/4E cells 48 h after transfection with osteopontin siRNA#1-scrambled (SCR), osteopontin siRNA#1 (os1) and osteopontin siRNA#2 (os2) at 20 nM. (C) Osteopontin total mRNA levels in NIH 3T3 and NIH 3T3/4E cells in complete (serum +) and media lacking serum (serum −). (Error bars indicate standard deviation from two independent measurements.) (D) Apoptotic frequency of NIH 3T3/4E cells 48 h after serum withdrawal in response to osteopontin (Spp1) siRNA#1 or osteopontin (Spp1) siRNA#1-scrambled siRNA. (Error bars indicate standard deviation from two independent experiments.)

Similar articles

Cited by

References

    1. Keene J.D., Lager P.J. Post-transcriptional operons and regulons co-ordinating gene expression. Chromosome Res. 2005;13:327–337. - PubMed
    1. Dever T.E. Gene-specific regulation by general translation factors. Cell. 2002;108:545–556. - PubMed
    1. Preiss T., Hentze M.W. Starting the protein synthesis machine: eukaryotic translation initiation. Bioessays. 2003;25:1201–1211. - PubMed
    1. Hershey J., Merrick W. The pathway and mechanism of protein synthesis. In: Sonenberg N., Hershey J., Mathews M., editors. Translational Control of Gene Expression. Cold Spring Harbor, NY: Cold Spring Harbor Laboratory Press; 2000. pp. 33–88.
    1. Clark I.E., Wyckoff D., Gavis E.R. Synthesis of the posterior determinant Nanos is spatially restricted by a novel cotranslational regulatory mechanism. Curr. Biol. 2000;10:1311–1314. - PubMed

Publication types

Associated data