. 2006;45 Suppl 1(Suppl 1):S78-91.
doi: 10.1080/14992020600782956.

Benefits of bilateral cochlear implants and/or hearing aids in children

Affiliations

Benefits of bilateral cochlear implants and/or hearing aids in children

Ruth Y Litovsky et al. Int J Audiol. 2006.

Abstract

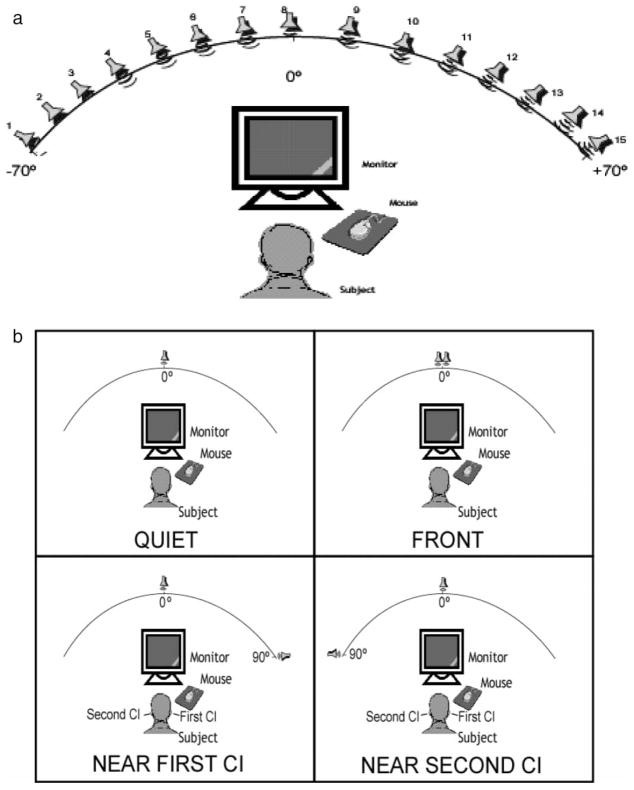
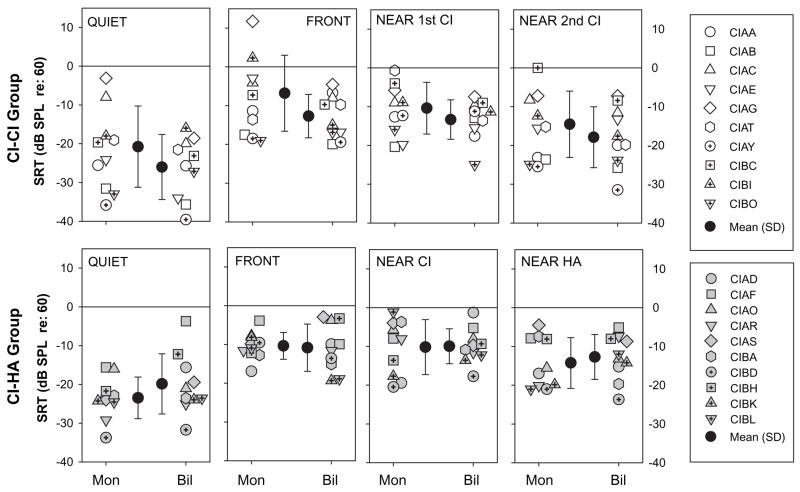
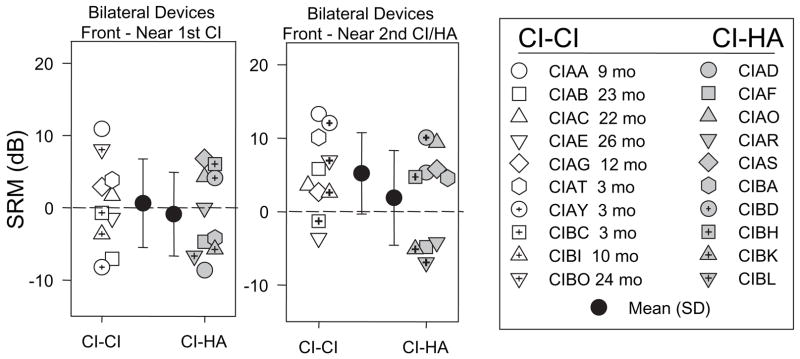
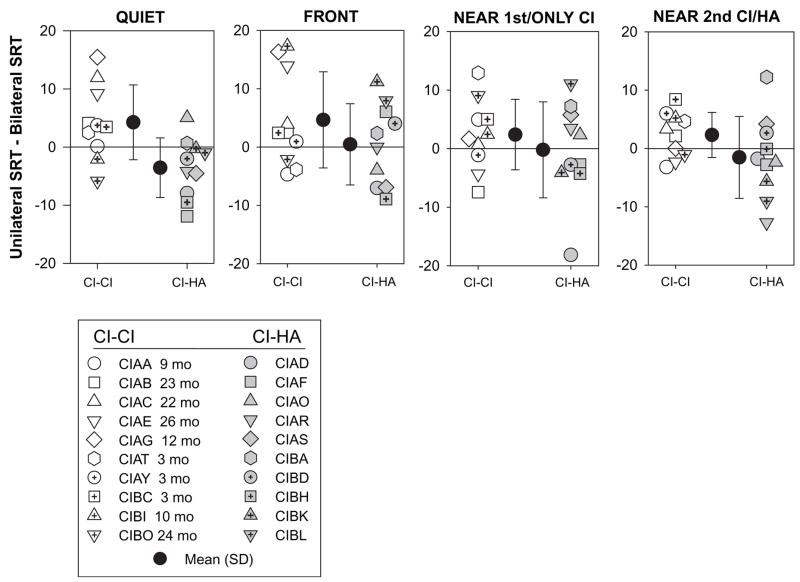
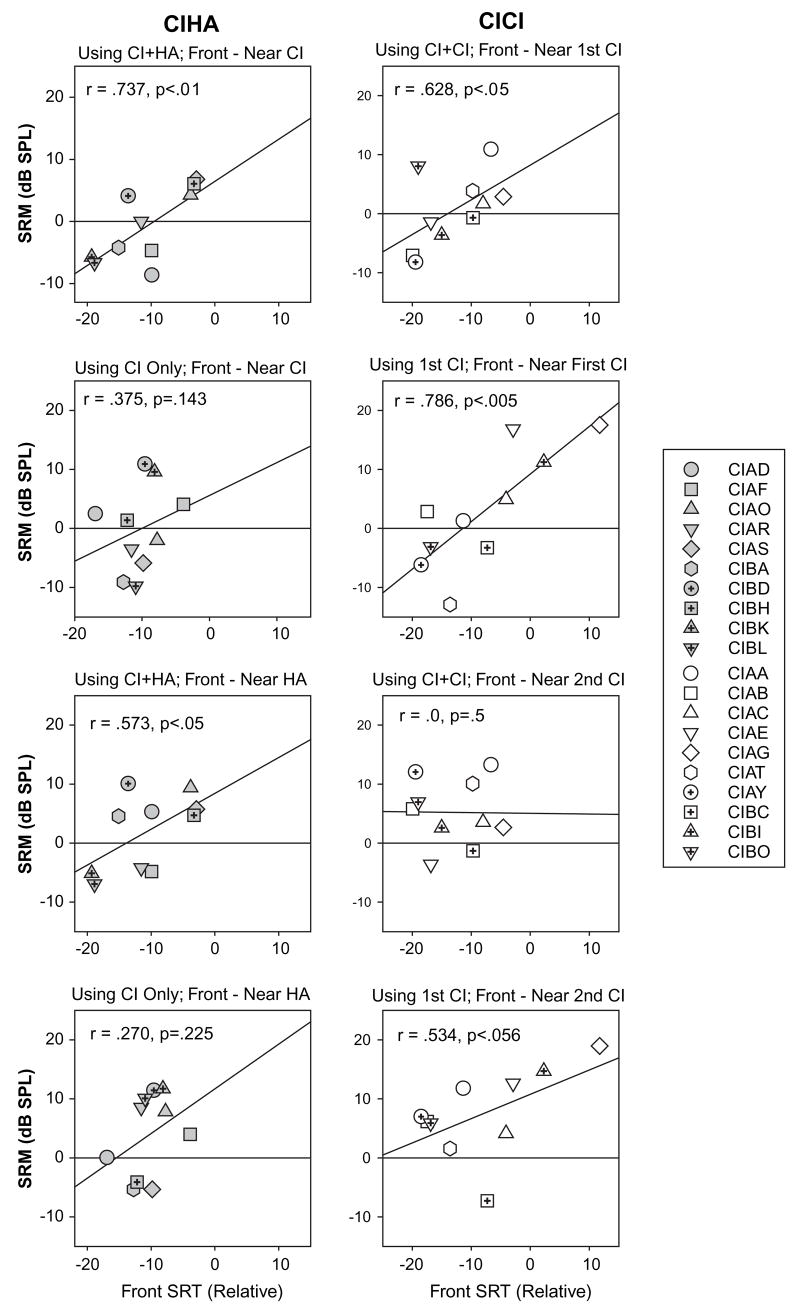
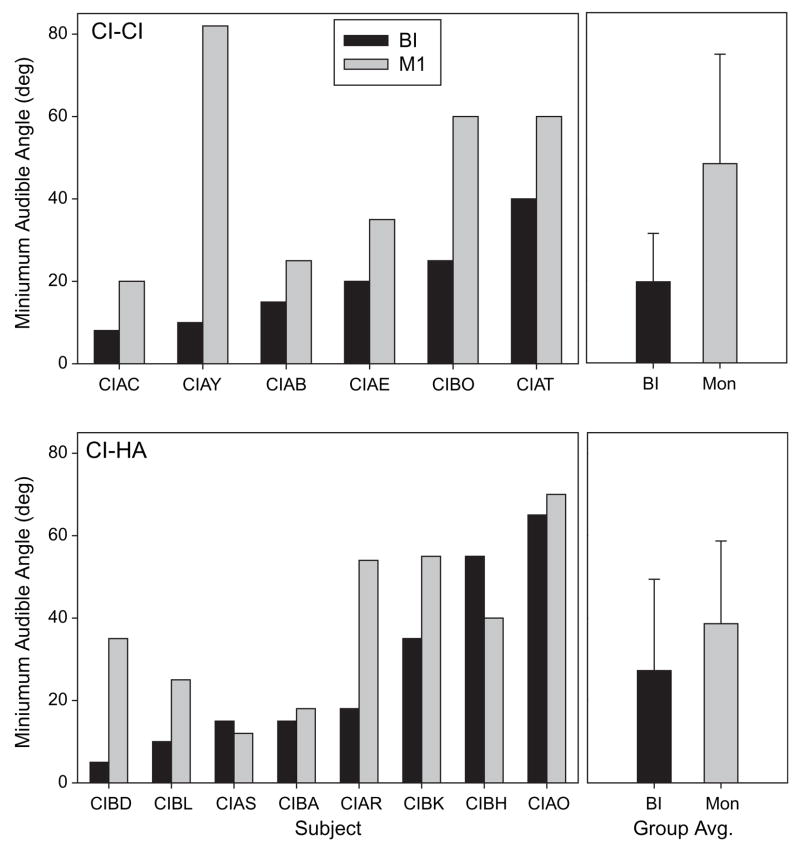
This study evaluated functional benefits from bilateral stimulation in 20 children ages 4-14, 10 use two CIs and 10 use one CI and one HA. Localization acuity was measured with the minimum audible angle (MAA). Speech intelligibility was measured in quiet, and in the presence of 2-talker competing speech using the CRISP forced-choice test. Results show that both groups perform similarly when speech reception thresholds are evaluated. However, there appears to be benefit (improved MAA and speech thresholds) from wearing two devices compared with a single device that is significantly greater in the group with two CI than in the bimodal group. Individual variability also suggests that some children perform similarly to normal-hearing children, while others clearly do not. Future advances in binaural fitting strategies and improved speech processing schemes that maximize binaural sensitivity will no doubt contribute to increasing the binaurally-driven advantages in persons with bilateral CIs.


Figures

Figure 1
Figure 1
Schematic diagram of testing setup. 1a) Array of 15 loudspeakers mounted on an arc with a radius of 1.5 m at ear level, positioned every 10° (− 70° to + 70°). 1b). One loudspeaker was mounted on the arc at center (0°) for the target, and a second loudspeaker was mounted at center, right or left, for the interferers. The left/right loudspeakers were re-positioned at the required angles for each testing condition.
Figure 2
Figure 2
Speech reception thresholds (SRTs) are plotted for the two groups of children, CI-CI on top and CI-HA on the bottom. Panel include results from the quiet condition (left), and the three conditions with competing speech talkers, whose locations were either in front, at 90° near the first CI or at 90° near the second CI. Each panel contains SRTs under monaural (first or single CI) and bilateral (CI-CI or CI-HA) listening modes. Individual results are shown as well as group mean (± SD). Note that SRTs are plotted relative to the level of the competing speech signals which, when presented, were at 60 dB SPL.
Figure 3
Figure 3
Spatial release from masking (SRM) values are plotted for the bilateral listening conditions, when the competing speech was either at 90° near the first CI (left panel) or at 90° near the second CI (right panel). Each panel compares results from the two groups of children. Individual results are shown as well as group mean (± SD). The legend indicates subject codes, and for the CI-CI children, the number of months after activation of the second CI.
Figure 4
Figure 4
The bilateral advantage (see text) is potted for the four listening conditions (quiet, or with interfering speech at front, near the first CI or near the second CI/HA), and within each panel Individual results are shown as well as group mean (± SD). The legend indicates subject codes, and for the CI-CI children, the number of months after activation of the second CI.
Figure 5
Figure 5
Correlations are shown for SRM values and SRTs obtained in the front (non spatial) condition. Results are shown separately for the CI-CI (right) and CI-HA group (left). Each panel contains values obtained for different listening conditions, when the children were using either both or one device, and when the competing speech was either near the first CI or on the other side. The exact condition is indicated in the text above each graph, and results from the correlation values are indicated within each plot.
Figure 6
Figure 6
MAA values are shown for individual children on the left, and group means (± SD) on the right. Values are compared for monaural (gray fill) and bilateral (black fill) listening modes. Results are shown separately for the CI-CI group (top) and CI-HA group (bottom). Subject codes are indicated below each graph.

References

    1. Armstrong M, Pegg P, James C, Blamey P. Speech perception in noise with implant and hearing aid. Am J Otol. 1997;18:S140–1. - PubMed
    1. Ching TY, Psarros C, Hill M, Dillon H, Incerti P. Should children who use cochlear implants wear hearing aids in the opposite ear? Ear Hear. 2001;22:365–80. - PubMed
    1. Ching TY, Incerti P, Hill M. Binaural benefits for adults who use hearing aids and cochlear implants in opposite ears? Ear Hear. 2004;25:9–21. - PubMed
    1. Ching TY, van Wanrooy E, Hill M, Dillon H. Binaural redundancy and inter-aural time difference cues for patients wearing a cochlear implant and a hearing aid in opposite ears. Int J Audiol. 2005;44:513–21. - PubMed
    1. Fu QJ, Shannon RV, Wang X. Effects of noise and spectral resolution on vowel and consonant recognition: acoustic and electric hearing. J Acoust Soc Am. 1998;104:3586–96. - PubMed

Publication types