

Patterns of nucleotide misincorporations during enzymatic amplification and direct large-scale sequencing of ancient DNA
- PMID: 16938852
- PMCID: PMC1564221
- DOI: 10.1073/pnas.0605327103
Patterns of nucleotide misincorporations during enzymatic amplification and direct large-scale sequencing of ancient DNA
Erratum in
- Proc Natl Acad Sci U S A. 2006 Oct 3;103(40):14977
Abstract
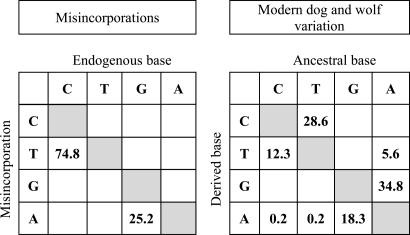
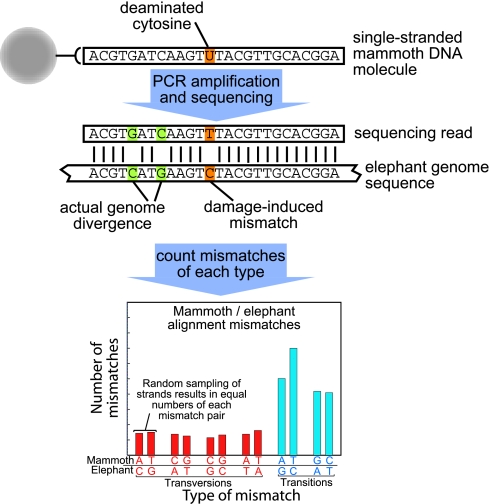
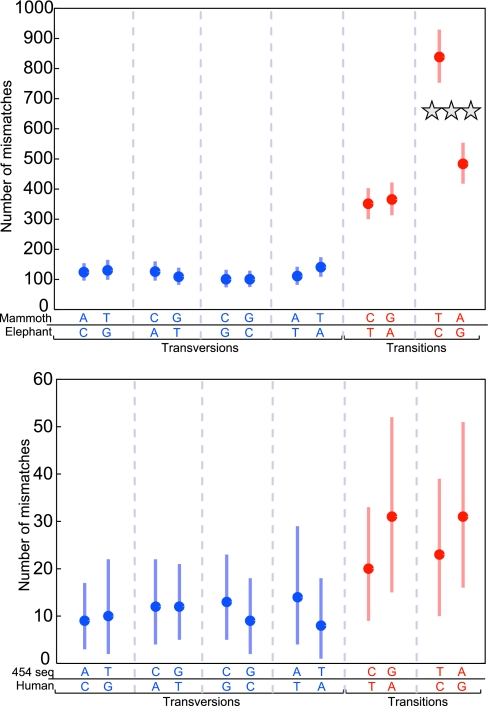
Whereas evolutionary inferences derived from present-day DNA sequences are by necessity indirect, ancient DNA sequences provide a direct view of past genetic variants. However, base lesions that accumulate in DNA over time may cause nucleotide misincorporations when ancient DNA sequences are replicated. By repeated amplifications of mitochondrial DNA sequences from a large number of ancient wolf remains, we show that C/G-to-T/A transitions are the predominant type of such misincorporations. Using a massively parallel sequencing method that allows large numbers of single DNA strands to be sequenced, we show that modifications of C, as well as to a lesser extent of G, residues cause such misincorporations. Experiments where oligonucleotides containing modified bases are used as templates in amplification reactions suggest that both of these types of misincorporations can be caused by deamination of the template bases. New DNA sequencing methods in conjunction with knowledge of misincorporation processes have now, in principle, opened the way for the determination of complete genomes from organisms that became extinct during and after the last glaciation.
Conflict of interest statement
Conflict of interest statement: No conflicts declared.
Figures
References
-
- Pääbo S, Poinar H, Serre D, Jaenicke-Despres V, Hebler J, Rohland N, Kuch M, Krause J, Vigilant L, Hofreiter M. Annu Rev Genet. 2004;38:645–679. - PubMed
-
- Loreille O, Orlando L, Patou-Mathis M, Philippe M, Taberlet P, Hanni C. Curr Biol. 2001;11:200–203. - PubMed
-
- Orlando L, Leonard JA, Thenot A, Laudet V, Guerin C, Hanni C. Mol Phylogenet Evol. 2003;28:485–499. - PubMed
Publication types
MeSH terms
Substances
Associated data
- Actions
- Actions
- Actions
- Actions
- Actions
- Actions
- Actions
- Actions
- Actions
- Actions
- Actions
- Actions
- Actions
- Actions
- Actions
- Actions
- Actions
- Actions
- Actions
- Actions
- Actions
- Actions
- Actions
- Actions
- Actions
- Actions
- Actions
- Actions
- Actions
LinkOut - more resources
Full Text Sources
Other Literature Sources
Miscellaneous
