

Population pharmacokinetics of atazanavir in patients with human immunodeficiency virus infection
- PMID: 16940065
- PMCID: PMC1635184
- DOI: 10.1128/AAC.00098-06
Population pharmacokinetics of atazanavir in patients with human immunodeficiency virus infection
Abstract
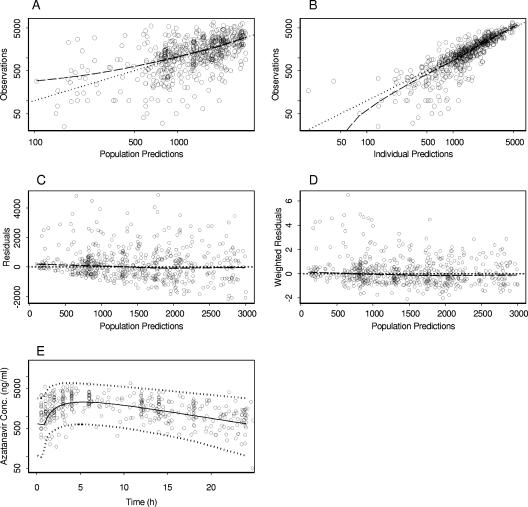
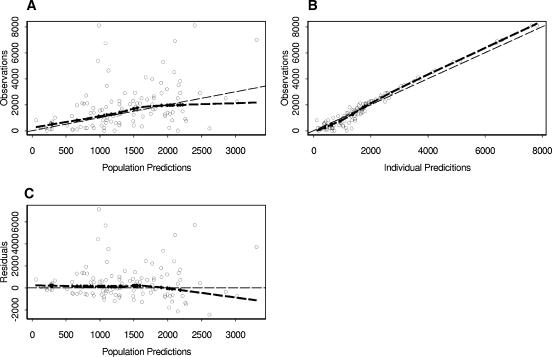
Atazanavir (ATV) is a new azapeptide protease inhibitor recently approved and currently used at a fixed dose of either 300 mg once per day (q.d.) in combination with 100 mg ritonavir (RTV) or 400 mg q.d. without boosting. ATV is highly bound to plasma proteins and extensively metabolized by CYP3A4. Since ATV plasma levels are highly variable and seem to be correlated with both viral response and toxicity, dosage individualization based on plasma concentration monitoring might be indicated. This study aimed to assess the ATV pharmacokinetic profile in a target population of HIV patients, to characterize interpatient and intrapatient variability, and to identify covariates that might influence ATV disposition. A population analysis was performed with NONMEM with 574 plasma samples from a cohort of 214 randomly selected patients receiving ATV. A total of 346 randomly collected ATV plasma levels and 19 full concentration-time profiles at steady state were available. The pharmacokinetic parameter estimates were an oral clearance (CL) of 12.9 liters/h (coefficient of variation [CV], 26%), a volume of distribution of 88.3 liters (CV, 29%), an absorption rate constant of 0.405 h(-1) (CV, 122%), and a lag time of 0.88 h. A relative bioavailability value was introduced to account for undercompliance due to infrequent follow-ups (0.81; CV, 45%). Among the covariates tested, only RTV significantly reduced CL by 46%, thereby increasing the ATV elimination half-life from 4.6 h to 8.8 h. The pharmacokinetic parameters of ATV were adequately described by a one-compartment population model. The concomitant use of RTV improved the pharmacokinetic profile. However, the remaining high interpatient variability suggests the possibility of an impact of unmeasured covariates, such as genetic traits or environmental influences. This population pharmacokinetic model, together with therapeutic drug monitoring and Bayesian dosage adaptation, can be helpful in the selection and adaptation of ATV doses.
Figures
References
-
- Akaike, H. 1974. A new look at the statistical model identification. IEEE Trans. Automat. Control 19:716-723.
-
- Barrios, A., A. L. Rendon, O. Gallego, L. Martin-Carbonero, L. Valer, P. Rios, I. Maida, T. Garcia-Benayas, I. Jimenez-Nacher, J. Gonzalez-Lahoz, and V. Soriano. 2004. Predictors of virological response to atazanavir in protease inhibitor-experienced patients. HIV Clin. Trials 5:201-205. - PubMed
-
- Beal, S. 1994. Validation of a population model. NONMEM UsersNet Archive, University of California San Francisco, San Francisco, Calif. [Online.] http://www.phor.com/nonmem/nmo/topic006.html.
-
- Bristol Myers Squibb Company. 2003. Investigator brochure atazanavir BMS-232632. Bristol Myers Squibb Company, Baar, Switzerland.
-
- Bristol Myers Squibb Company. 2005. Reyataz (atazanavir sulfate) capsules: prescribing information. [Online.] http://www.bms.com.
Publication types
MeSH terms
Substances
LinkOut - more resources
Full Text Sources
Medical
Research Materials
