

Isolates with low-level vancomycin resistance associated with persistent methicillin-resistant Staphylococcus aureus bacteremia
- PMID: 16940100
- PMCID: PMC1563555
- DOI: 10.1128/AAC.00422-06
Isolates with low-level vancomycin resistance associated with persistent methicillin-resistant Staphylococcus aureus bacteremia
Abstract
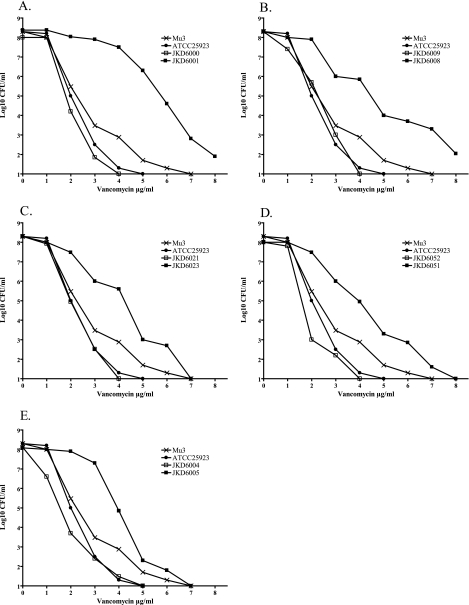
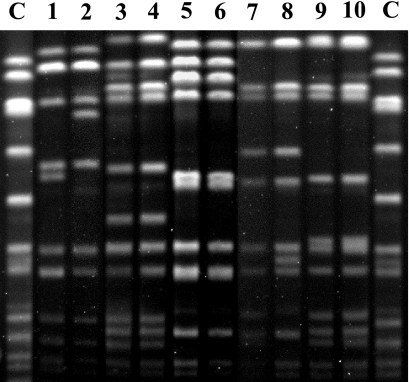
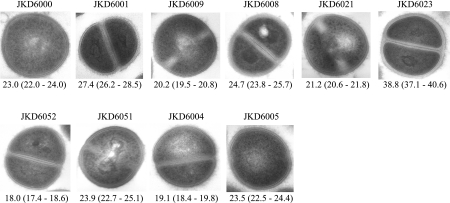
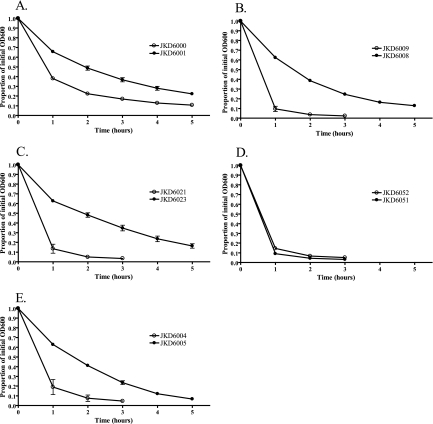
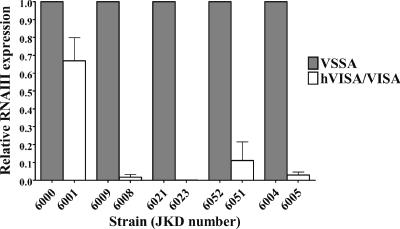
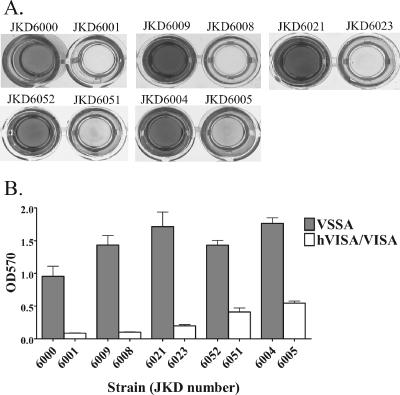
Low-level vancomycin-resistant Staphylococcus aureus (vancomycin-intermediate S. aureus [VISA] and heterogenous VISA [hVISA]) is increasingly reported and leads to glycopeptide treatment failure. Various phenotypic features have been reported for these isolates, but the genetic changes leading to hVISA and VISA have yet to be clearly determined. We assessed phenotypic, antibiotic resistance, and genomic changes by using genomic DNA microarray comparison and sequencing of selected loci in five pairs of clinical hVISA/VISA strains and the initial methicillin-resistant Staphylococcus aureus (MRSA) isolates obtained prior to vancomycin therapy. The isolates were from adult patients in Australia and New Zealand who had persistent MRSA bacteremia (>7 days) while receiving vancomycin therapy. In all cases, the initial isolates were found to be fully vancomycin-susceptible Staphylococcus aureus (VSSA). The hVISA/VISA phenotype was associated with increased cell wall thickness, reduced autolytic activity in four of five hVISA/VISA strains, and a striking reduction in biofilm formation compared to the parent strains in all pairs. All five pairs appeared to be isogenic, and genomic DNA microarray comparison suggested that major genetic changes are not required for the development of the resistant phenotype in these strains. No sequence differences were found in the agr locus or the tcaRA genes for any pair, but a marked reduction in RNAIII expression was found in four pairs. In summary, hVISA/VISA arises from fully VSSA during persistent infection that fails to respond to glycopeptide therapy and is associated with significant phenotypic changes, including a marked reduction in biofilm-forming ability. These clinically derived pairs of isolates will be a useful resource to elucidate the genetic mechanism of resistance in hVISA/VISA strains.
Figures
References
-
- Brandenberger, M., M. Tschierske, P. Giachino, A. Wada, and B. Berger-Bachi. 2000. Inactivation of a novel three-cistronic operon tcaR-tcaA-tcaB increases teicoplanin resistance in Staphylococcus aureus. Biochim. Biophys. Acta 1523:135-139. - PubMed
-
- Charles, P. G., P. B. Ward, P. D. Johnson, B. P. Howden, and M. L. Grayson. 2004. Clinical features associated with bacteremia due to heterogeneous vancomycin-intermediate Staphylococcus aureus. Clin. Infect. Dis. 38:448-451. - PubMed
Publication types
MeSH terms
Substances
LinkOut - more resources
Full Text Sources
Other Literature Sources
Molecular Biology Databases
Miscellaneous
