. 2006 Nov;26(21):7901-12.
doi: 10.1128/MCB.01004-06. Epub 2006 Aug 28.

Role of the transcription activator Ste12p as a repressor of PRY3 expression

Affiliations

Role of the transcription activator Ste12p as a repressor of PRY3 expression

Kellie S Bickel et al. Mol Cell Biol. 2006 Nov.

Abstract

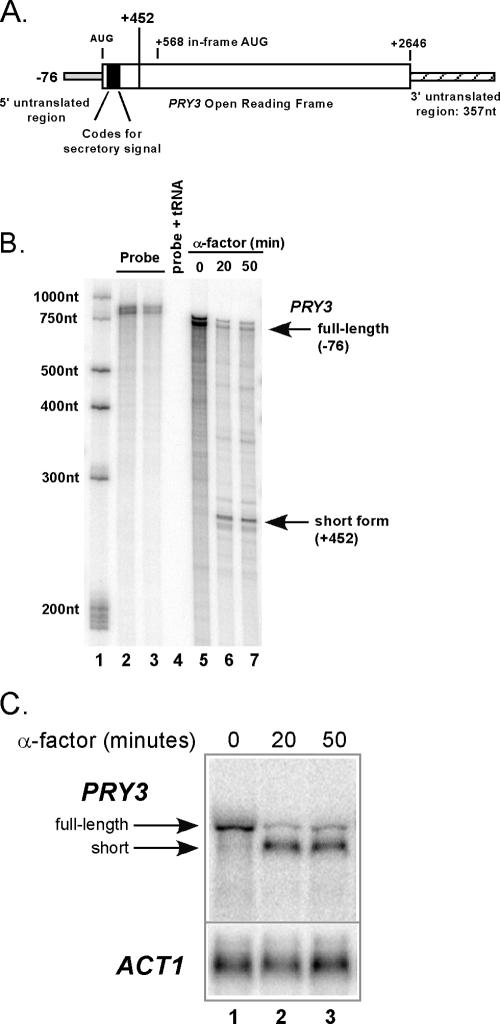
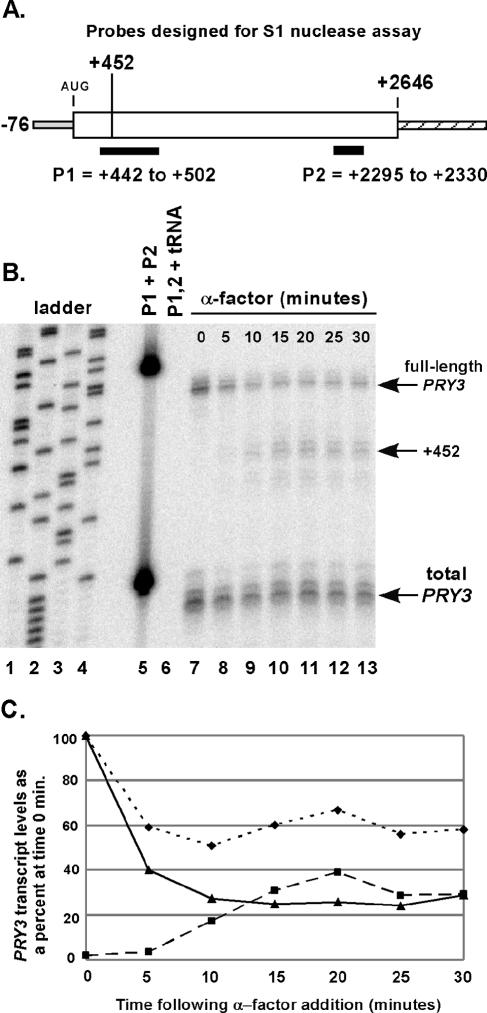
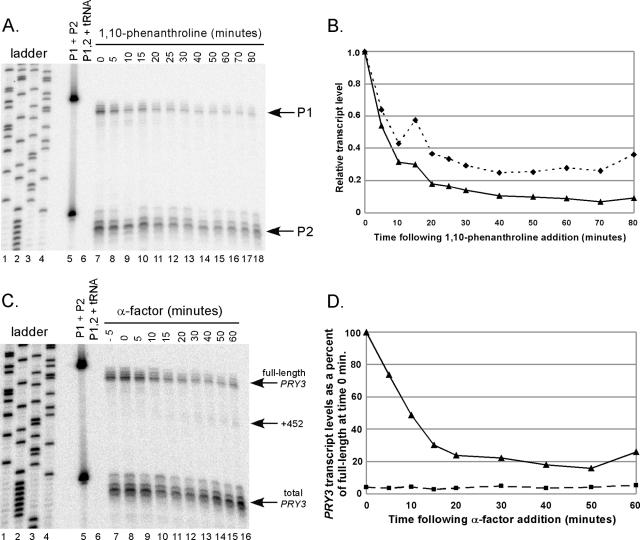
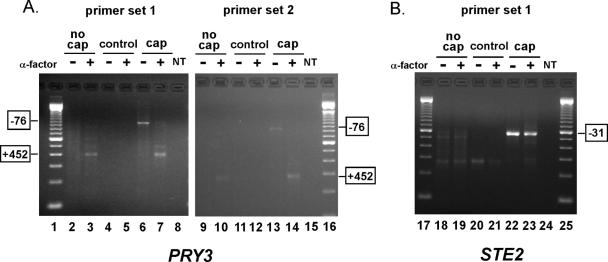
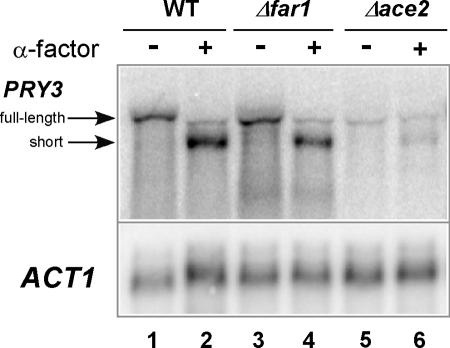
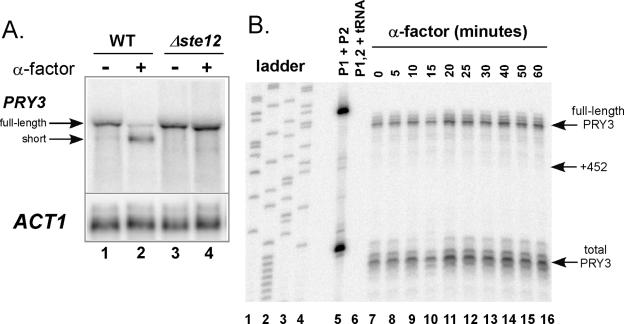
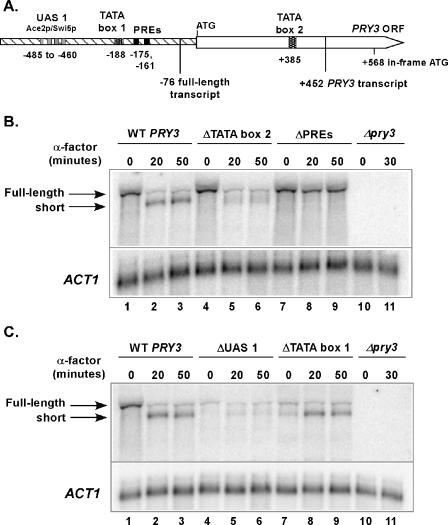
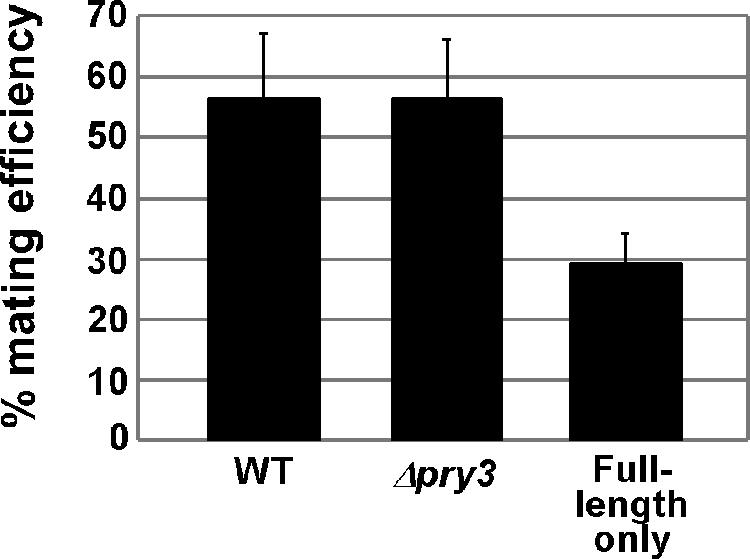
Mating pheromone represses synthesis of full-length PRY3 mRNA, and a new transcript appears simultaneously with its 5' terminus 452 nucleotides inside the open reading frame (ORF). Synthesis of this shorter transcript results from activation of a promoter within the PRY3 locus, and its production is concomitant with the rapid disappearance of the full-length transcript. Evidence is consistent with the pheromone-induced transcription factor Ste12p binding two pheromone response elements within the PRY3 promoter, directly impeding transcription of the full-length mRNA while simultaneously inducing initiation of the short transcript. This process depends on a TATA box within the PRY3 ORF. Expression of full-length PRY3 inhibited mating, while no disadvantage was detectable for cells unable to make the short transcript. Therefore, Ste12p is utilized as a repressor of full-length PRY3 transcription, ensuring efficient mating. There is no evidence that production of the short PRY3 transcript is anything more than an adventitious by-product of this mechanism. It is possible that cryptic binding sites for transcriptional activators may occur frequently within genomes and have the potential of evolving for rapid, gene-specific repression by mechanisms analogous to PRY3. PRY3 regulation provides a model for the coordination of both inductive and repressive activities within a regulatory network.


Figures

FIG. 1.
FIG. 1.
Identification of an altered 5′ transcript structure of PRY3 in cells treated with α-factor. (A) Diagram of PRY3 transcript showing transcriptional and translational start sites for the full-length transcript. The terminus of the short 5′ transcript is marked by the line at +452. A possible translational start site at an in-frame AUG is highlighted at +568. (B) RNase protection assay of PRY3 performed on RNA isolated from untreated cells (lane 5) or cells treated with α-factor for 20 and 50 min (lanes 6 and 7). The RNase protection probe, containing 719 nucleotides of coding sequence and detecting both PRY3 transcriptional start sites, is shown in lanes 2 and 3 at two concentrations. An RNA ladder (lane 1) allows calculation of probe protection and confirms 5′ termini of the two PRY3 transcripts (marked with arrows). Lane 4 is probe mixed with tRNA (50 μg) as a digestion control. These data are representative of three independent experiments. (C) Northern analysis of PRY3 in wild-type cells treated with α-factor. RNA was isolated from cells that were treated or not for 20 and 50 min. The blot was reprobed for ACT1 as a loading control. This result was obtained in four independent experiments. The arrows mark the full-length and short PRY3-specific transcripts.
FIG. 2.
FIG. 2.
Kinetics of alteration in PRY3 transcript structure during an α-factor time course. (A) Oligonucleotide probes for S1 nuclease assay were designed as shown, with an additional five bases of nonhomologous sequence at the 5′ end of the probe to control for S1 nuclease activity. (B) Total RNA was isolated from wild-type cells treated or not treated with α-factor for the indicated times. Probe hybridization was performed with a mix of both probes, followed by S1 nuclease digestion (see Materials and Methods). A sequencing reaction from pBSII SK(+) plasmid generated the base pair ladder (lanes 1 to 4). Lane 5 is the mixture of the two probes with no S1 added during the experiment. Lane 6 is the probe mixture hybridized to tRNA (50 μg) as a digestion control. These data are representative of five independent experiments. (C) Levels of full-length transcript (solid line with triangles) and +452 transcript (dashed line with squares) were quantified from the S1 nuclease assay in panel B. Values for both are shown as a percentage of the intensity of the full-length transcript at 0 min. Total PRY3 levels (dotted line with diamonds) are the P2 probe quantities for the α-factor time course plotted as percentage of the total transcript at 0 min.
FIG. 3.
FIG. 3.
Analysis of PRY3 transcript structure in the presence of RNA Pol II inhibitor. (A) Total RNA was isolated from wild-type cells treated or not treated with 1,10-phenanthroline (100 μg/ml) for the times indicated, followed by S1 nuclease assay as described in the Fig. 2 legend. (B) Levels of PRY3 transcript from panel A as detected by the 5′ oligonucleotide probe (P1; solid line with triangles) or as detected by the 3′ probe (P2; dotted line with diamonds) were individually quantified and shown as a fraction of the PRY3 transcript from cells at 0 min. Data are representative of four independent experiments. (C) Wild-type cells were treated with 1,10-phenanthroline (100 μg/ml) for 5 min prior to the addition of α-factor at 0 min. Total RNA was isolated from cells harvested and frozen at the times indicated, followed by S1 nuclease assay as described in the Fig. 2 legend. (D) Levels of full-length transcript (solid line with triangles) and +452 transcript (dashed line with squares) from panel C were quantified and shown as a percentage of the full-length transcript from cells at 0 min. Data are representative of three independent experiments.
FIG. 4.
FIG. 4.
PRY3 5′ cap analysis by RNA ligase-mediated RACE. Transcript-specific RACE PCR products were analyzed by agarose gel electrophoresis. Data shown are representative of three independent experiments each using two independent, gene-specific primer sets demonstrating transcript specificity. For both PRY3- and STE2-specific RACE reactions, amplification products in the “no cap” lanes indicate the RNA adaptor ligated to the exposed 5′ phosphates of uncapped transcripts. “Control” lanes indicate completeness of the CIP reaction. Amplification products in the “cap” lanes indicate the transcripts in which the RNA adaptor ligated to the newly exposed 5′ phosphate groups of capped transcripts following the removal of the 5′ cap by TAP. “NT” represents no-template control for PCRs. Lanes 1, 16, 17, and 25 are loaded with a 100-bp ladder. PCR products were isolated from lanes 3, 6, 7, 10, 13, 14, 22, and 23 and sequenced. (A) PRY3 RLM-RACE results for both primer sets used. Sequencing results from PCR products from lanes 3, 7, 10, and 14 demonstrated 5′ termini at +452 relative to the AUG translation initiation codon. Sequencing results from lanes 6 and 13 demonstrated 5′ termini at −76. (B) STE2, an α-factor-induced transcript which has a known 5′ transcriptional start site of −31 relative to the initiating AUG, was used as a control (results shown for primer set 1).
FIG. 5.
FIG. 5.
PRY3 expression is FAR1 independent but ACE2 dependent. Northern analysis of PRY3 in total RNA isolated from wild-type (WT), Δfar1, and Δace2 cells untreated or treated with α-factor for 30 min. The blot was reprobed for ACT1 as a loading control. Data are representative of two independent experiments.
FIG. 6.
FIG. 6.
Pheromone-induced PRY3 transcript regulation is STE12 dependent. (A) Northern analysis of PRY3 in total RNA isolated from wild-type (WT) and Δste12 strains untreated and treated with α-factor for 30 min. The blot was reprobed for ACT1 as a loading control. (B) S1 nuclease assay was performed on total RNA extracts from Δste12 cells isolated during an α-factor time course assay as described in the Fig. 2 legend.
FIG. 7.
FIG. 7.
Analysis of PRY3 promoter elements. (A) Diagram depicting promoter elements for the full-length and α-factor-induced transcripts. (B) Northern analysis of PRY3 transcript in total RNA isolated from Δpry3 strains carrying the following plasmids: wild-type (WT) construct, mutated TATA box 2 at +385, deleted PREs, and empty vector. RNA was isolated from cells untreated and treated with α-factor for 20 and 50 min. The blot was reprobed for ACT1 as a loading control. Data shown are representative of two biologically independent experiments from Δpry3loc and Δpry3 strains carrying the plasmids. (C) Northern analysis of PRY3 in total RNA isolated from Δpry3 strains carrying the following plasmids: wild-type (WT) construct, deleted UAS 1, mutated TATA box 1 at −188, and empty vector. RNA was isolated from cells untreated and treated with α-factor for 20 and 50 min. The blot was reprobed for ACT1 as a loading control. Data shown are representative of two biologically independent experiments from Δpry3loc and Δpry3 strains carrying the plasmids.
FIG. 8.
FIG. 8.
Production of full-length PRY3 is inhibitory to mating. The figure shows MATa Δpry3 strains carrying the PRY3 wild-type (WT) construct, empty vector, or the PRY3 PRE deletion construct (full length only). Results are averages of four independent experiments. Wild-type cells carrying an empty vector mated with the same efficiency as did Δpry3 cells carrying a wild-type construct in two experiments (data not shown).

Similar articles

Cited by

References

    1. Adhya, S., and M. Gottesman. 1982. Promoter occlusion: transcription through a promoter may inhibit its activity. Cell 29:939-944. - PubMed
    1. Basehoar, A. D., S. J. Zanton, and B. F. Pugh. 2004. Identification and distinct regulation of yeast TATA box-containing genes. Cell 116:699-709. - PubMed
    1. Beltzer, J. P., S. R. Morris, and G. B. Kohlhaw. 1988. Yeast LEU4 encodes mitochondrial and nonmitochondrial forms of alpha-isopropylmalate synthase. J. Biol. Chem. 263:368-374. - PubMed
    1. Bird, A. J., E. Blankman, D. J. Stillman, D. J. Eide, and D. R. Winge. 2004. The Zap1 transcriptional activator also acts as a repressor by binding downstream of the TATA box in ZRT2. EMBO J. 23:1123-1132. - PMC - PubMed
    1. Boguta, M., L. A. Hunter, W. C. Shen, E. C. Gillman, N. C. Martin, and A. K. Hopper. 1994. Subcellular locations of MOD5 proteins: mapping of sequences sufficient for targeting to mitochondria and demonstration that mitochondrial and nuclear isoforms commingle in the cytosol. Mol. Cell. Biol. 14:2298-2306. - PMC - PubMed

Publication types

MeSH terms