. 2006 Nov;26(21):8061-74.
doi: 10.1128/MCB.01102-06. Epub 2006 Aug 28.

Molecular architecture of a eukaryotic DNA replication terminus-terminator protein complex

Affiliations

Molecular architecture of a eukaryotic DNA replication terminus-terminator protein complex

Gregor Krings et al. Mol Cell Biol. 2006 Nov.

Abstract

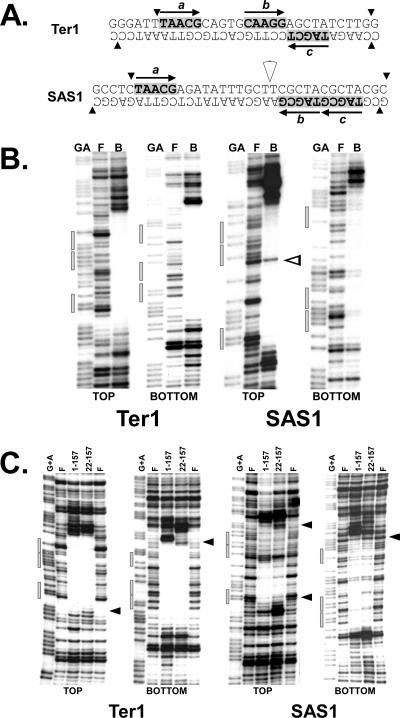
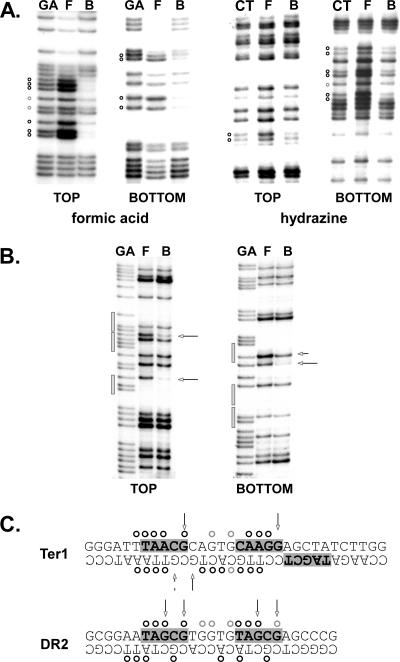
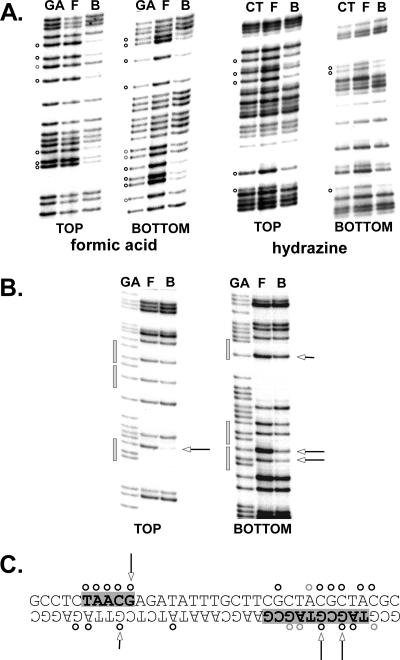
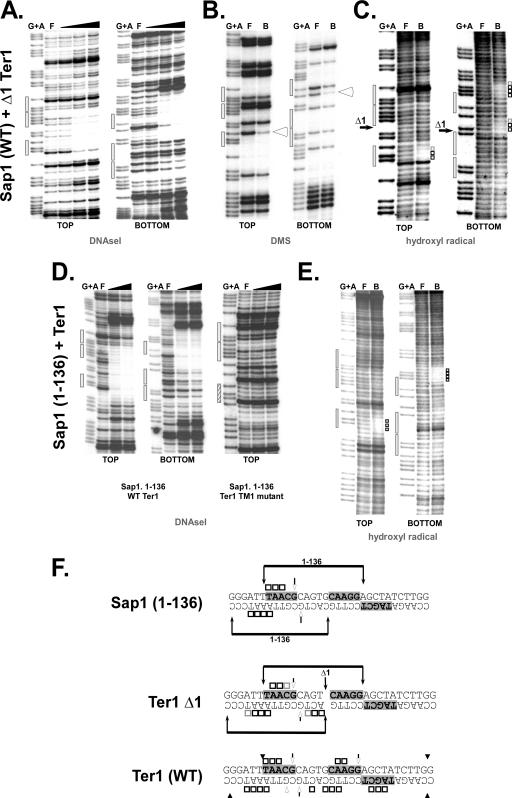
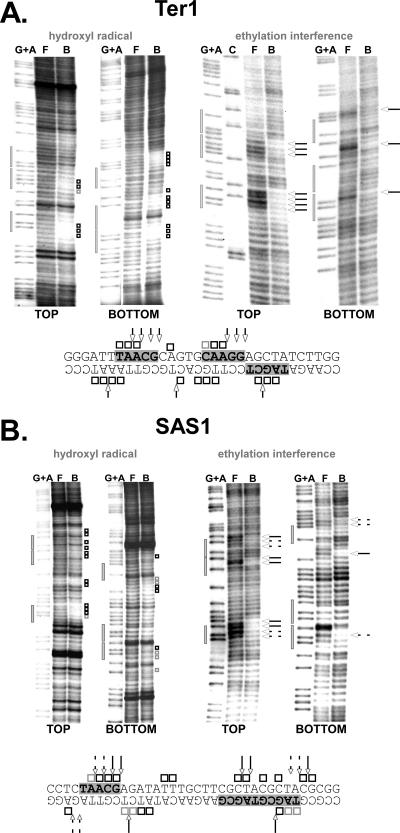
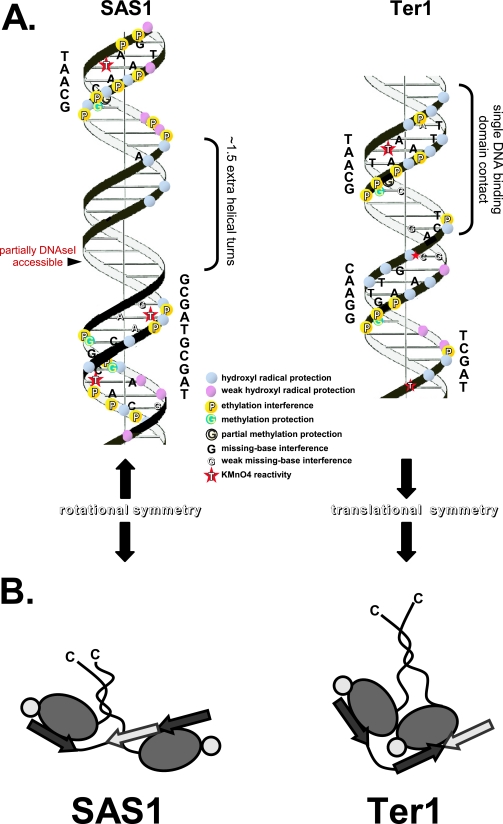
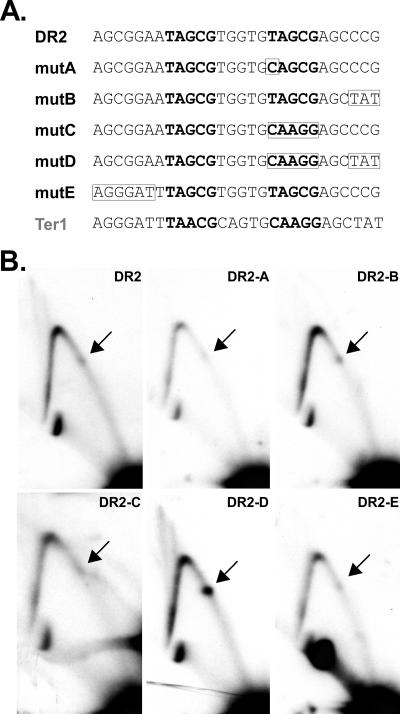
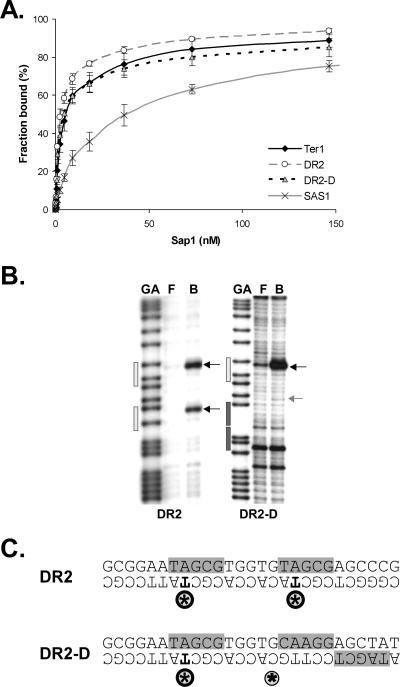
DNA replication forks pause at programmed fork barriers within nontranscribed regions of the ribosomal DNA (rDNA) genes of many eukaryotes to coordinate and regulate replication, transcription, and recombination. The mechanism of eukaryotic fork arrest remains unknown. In Schizosaccharomyces pombe, the promiscuous DNA binding protein Sap1 not only causes polar fork arrest at the rDNA fork barrier Ter1 but also regulates mat1 imprinting at SAS1 without fork pausing. Towards an understanding of eukaryotic fork arrest, we probed the interactions of Sap1 with Ter1 as contrasted with SAS1. The Sap1 dimer bound Ter1 with high affinity at one face of the DNA, contacting successive major grooves. The complex displayed translational symmetry. In contrast, Sap1 subunits approached SAS1 from opposite helical faces, forming a low-affinity complex with mirror image rotational symmetry. The alternate symmetries were reflected in distinct Sap1-induced helical distortions. Importantly, modulating protein-DNA interactions of the fork-proximal Sap1 subunit with the nonnatural binding site DR2 affected blocking efficiency without changes in binding affinity or binding mode but with alterations in Sap1-induced DNA distortion. The results reveal that Sap1-DNA affinity alone is insufficient to account for fork arrest and suggest that Sap1 binding-induced structural changes may result in formation of a competent fork-blocking complex.


Figures

FIG. 1.
FIG. 1.
DNase I footprinting of wild-type and truncated His6-Sap1 mutants complexed with Ter1 or SAS1. (A) Sequence comparison of Ter1 and SAS1. Sap1 core motifs a, b, and c are highlighted in light gray, and directions of the repeats are depicted by black arrows above and below the sequences. The extent of DNase I protection by wild-type His6-Sap1 (see below) is denoted by black arrowheads. The white arrowhead above SAS1 between motifs a and b denotes the internal DNase I accessible site. (B) DNase I footprinting of His6-Sap1 on top and bottom strands of Ter1 and SAS1. The white arrowhead denotes the internal DNase I accessible site in the top strand of complexed SAS1. Locations of the core motifs a to c are denoted by gray boxes. All lanes contain 30 fmol Ter1 or SAS1. Lanes GA, G+A Maxam-Gilbert sequencing ladder; lanes F, uncomplexed (free) DNA probe; lanes B, DNA probe plus 40 ng (Ter1) or 60 ng (SAS1) His6-Sap1. (C) DNase I footprinting of His6-Sap1(1-157) and His6-Sap1(22-157) truncation mutants on the top and bottom strands of Ter1 and SAS1. Each lane contains 30 fmol DNA probe. Black arrowheads denote regions of decreased protection of Ter1 or SAS1 by the Sap1(22-157) mutant compared to the Sap1(1-157) mutant (and wild-type) protein. Lanes 3, DNA probe plus 50 ng (Ter1) or 100 ng (SAS1) His6-Sap1(1-157); lanes 4, DNA probe plus 50 ng (Ter1) or 100 ng (SAS1) His6-Sap1(22-157). Other lanes are defined above.
FIG. 2.
FIG. 2.
Base-specific contacts of His6-Sap1 on Ter1. (A) Representative missing base contact interference gels of top and bottom depurinated (left two panels) and depyrimidated (right two panels) Ter1 sites. Black circles denote bases revealing strong interference when missing, whereas gray circles represent relatively weaker interference. (B) Representative DMS methylation protection gels of top and bottom strands of Ter1. The long white arrows denote regions of strong protection, whereas the short arrow denotes a region of relatively weaker protection. Lanes GA, CT, F, and B denote G+A Maxam-Gilbert sequencing ladders, C+T Maxam-Gilbert sequencing ladders, uncomplexed (free) DNA probe, and complexed (bound) DNA probe, respectively. (C) Summary diagram of His6-Sap1 base-specific contacts on Ter1 compared to the nonnatural direct-repeat binding site DR2. Core motifs a, b, and c are highlighted in light gray. Symbols are described above.
FIG. 3.
FIG. 3.
Base-specific contacts of His6-Sap1 on SAS1. (A) Representative missing base contact interference gels of top and bottom depurinated (left two panels) and depyrimidated (right two panels) SAS1 sites. (B) Representative DMS methylation protection gels of top and bottom strands of SAS1. (C) Summary diagram of His6-Sap1 base-specific contacts on SAS1. Symbols and lane designations are described in the legend for Fig. 2.
FIG. 4.
FIG. 4.
Motif a of Ter1 acts as a nucleation center for assembly of the Sap1 dimer. (A) DNase I footprints of His6-Sap1 complexed with the top and bottom strands of the Ter1 Δ1 mutant. All lanes contain 30 fmol Ter1 or Ter mutant DNA. Lanes G+A, Maxam-Gilbert G+A sequencing ladder; lanes F, DNase I-treated uncomplexed (free) Ter1 Δ1 mutant; lanes 3 to 5, DNase I-treated Ter1 Δ1 mutant bound with 10, 50, and 100 ng of His6-Sap1, respectively. (B) DMS methylation protection of top and bottom strands of the Ter1 Δ1 mutant. All lanes contain 30 fmol Ter1 Δ1 mutant DNA. Lanes F, uncomplexed (free) Ter1 Δ1 mutant; lanes B, Ter1 Δ1 mutant plus 300 ng of His6-Sap1. White arrowheads denote protected guanines. (C) Hydroxyl radical protection footprints of top and bottom strands of the Ter1 Δ1 mutant in the presence and absence of His6-Sap1. All lanes contain 15 fmol Ter1 Δ1 mutant DNA. Lanes F, uncomplexed (free) Ter1 Δ1 mutant; lanes B, Ter1 Δ1 mutant plus 100 ng of His6-Sap1. The location of the Δ1 deletion is noted. (D) DNase I footprints of the His6-Sap1(1-136) truncation mutant complexed with the top and bottom strands of wild-type Ter1 and with the top strand of the Ter1 TM1 triple mutant. All lanes contain 30 fmol DNA. Lanes F, uncomplexed (free) Ter1 (or TM1 mutant); lanes 3 and 4, Ter1 (or TM1 mutant) bound with 200 and 400 ng of His6-Sap1, respectively (or with 400 and 600 ng of His6-Sap1 for the TM1 mutant). (E) Hydroxyl radical protection footprints of top and bottom strands of wild-type Ter1 in the presence and absence of His6-Sap1(1-136). All lanes contain 15 fmol Ter1. Lanes F, uncomplexed (free) Ter1; lanes B, Ter1 bound with 100 ng of the His6-Sap1(1-136) mutant. (F) Summary diagram of contact data presented in panels A to E. Regions of DNase I protection are indicated with brackets. Small black boxes represent strong protection from hydroxyl radical cleavage, and small gray boxes represent relatively weaker protection. Locations of the core motifs a to c are denoted by long gray boxes. WT, wild type.
FIG. 5.
FIG. 5.
Sap1 sugar-phosphate backbone contacts at Ter1 and SAS1. (A) (Left two panels) Hydroxyl radical protection footprinting of His6-Sap1 on the top and bottom strands of Ter1. All lanes contain 15 fmol Ter1. Lanes G+A, G+A Maxam-Gilbert Ter1 sequencing ladder; lanes F, uncomplexed (free) Ter1; lanes B, Ter1 plus 50 ng His6-Sap1. (Right two panels) Ethylation interference footprinting of His6-Sap1 on the top and bottom strands of Ter1. Lane C, C Maxam-Gilbert Ter1 sequencing ladder; lanes B, Ter1 plus His6-Sap1. A diagrammatic representation of Sap1-Ter1 backbone contacts is shown below the panels. (B) (Left two panels) Hydroxyl radical protection footprinting of His6-Sap1 on the top and bottom strands of SAS1. All lanes contain 15 fmol SAS1. Lanes G+A, G+A Maxam-Gilbert SAS1 sequencing ladder; lanes F, uncomplexed (free) SAS1; lanes B, SAS1 plus 100 ng His6-Sap1. (Right two panels) Ethylation interference footprinting of His6-Sap1 on the top and bottom strands of SAS1. Lanes B, SAS1 plus His6-Sap1. A diagrammatic representation of Sap1-SAS1 backbone contacts is shown below the panels. Locations of ethylated phosphate groups that strongly or partially interfere with Sap1 binding are denoted by white solid and hatched arrows, respectively. Locations of the core motifs a to c are denoted by long gray boxes. Locations of strongly and partially protected sugars are denoted by small black and gray boxes, respectively.
FIG. 6.
FIG. 6.
Sap1 binding causes different patterns of KMnO4-sensitive structural distortions at Ter1 and SAS1. (A) (Left two panels) KMnO4 probing of the top and bottom strands of Ter1 in the presence and absence of His6-Sap1 binding. All lanes contain 20 fmol Ter1. Lanes G+A, G+A Maxam-Gilbert Ter1 sequencing ladder; lanes F, uncomplexed (free) Ter1; lanes B, Ter1 plus 50 ng His6-Sap1. (Right two panels) KMnO4 probing of the top and bottom strands of SAS1 in the presence and absence of His6-Sap1 binding. All lanes contain 20 fmol SAS1. Lanes G+A, G+A Maxam-Gilbert SAS1 sequencing ladder; lanes F, uncomplexed (free) SAS1; lanes B, SAS1 plus 100 ng His6-Sap1. (B) KMnO4 probing of the bottom strand of Ter1 in the presence or absence of His6-Sap1 truncation mutants. All lanes contain 20 fmol Ter1. Lane G+A, G+A Maxam-Gilbert Ter1 sequencing ladder; lanes F, uncomplexed (free) Ter1; lanes 3 and 4, Ter1 plus 200 and 400 ng His6-Sap1(1-136), respectively; lane 5, Ter1 plus 50 ng His6-Sap1(1-157); lane 6, Ter1 plus 50 ng His6-Sap1(22-157). Hypersensitive thymines and cytosines are depicted by white and gray arrowheads, respectively. Locations of the core motifs a to c are depicted by gray boxes. (C) Diagrammatic representations of Ter1 and SAS1 pyrimidines that become hypersensitive to KMnO4 oxidation upon His6-Sap1 binding. Encircled asterisks represent sensitive thymines, and plain asterisks represent sensitive cytosines. The degree of sensitivity is denoted by the size of the respective symbol. Core motifs a, b, and c are highlighted in light gray, and directions of the repeats are depicted by black arrows.
FIG. 7.
FIG. 7.
Schematic representations of Sap1 bound to Ter1 versus SAS1. (A) Helical projections of SAS1 and Ter1 sites, summarizing locations of Sap1 base-specific and sugar-phosphate contacts, as well as sites of KMnO4 reactivity. Note the alternate symmetries displayed by the subunits of the Sap1 dimer bound to Ter1 versus Sap1. (B) Models of Sap1-SAS1 and Sap1-Ter1 complexes.
FIG. 8.
FIG. 8.
Conversion of the nonnatural Sap1 binding site DR2 from an inefficient into an efficient replication fork barrier by modulation of the protein-DNA interactions of the fork-proximal Sap1 subunit. (A) Sequence comparison of DR2, Ter1, and the DR2 mutants analyzed (mutA, DR2-A mutant; mutB, DR2-B mutant; etc.). The core motifs are shown in bold, and mutated regions are boxed. (B) 2D gels of DR2 and DR2-A to DR2-E mutants. PvuII-digested replication intermediates of the respective plasmids were prepared as described in Materials and Methods. Note the weak fork barrier activity of DR2 (black arrow), which is dramatically increased in the DR2-D mutant.
FIG. 9.
FIG. 9.
Analysis of Sap1-DNA interaction at various binding sites reveals structural rearrangements without changes in binding affinity. (A) Binding curves of His6-Sap1 bound to Ter1, DR2, the DR2-D mutant, or SAS1. (B) KMnO4 probing of the bottom strands of DR2 and DR2-D. All lanes contained 20 fmol DNA probe. Lanes GA, G+A Maxam-Gilbert sequencing ladder; lanes F, uncomplexed (free) DNA; lanes B, DNA plus 80 ng His6-Sap1. Locations of the core motifs and mutated motifs are denoted by light- and dark-gray boxes, respectively. (C) Summary of KMnO4 probing of DR2 versus DR2-D. Symbols are described in the legend for Fig. 6.

Similar articles

Cited by

References

    1. Ahn, J. S., F. Osman, and M. C. Whitby. 2005. Replication fork blockage by RTS1 at an ectopic site promotes recombination in fission yeast. EMBO J. 24:2011-2023. - PMC - PubMed
    1. Arcangioli, B., T. D. Copeland, and A. J. Klar. 1994. Sap1, a protein that binds to sequences required for mating-type switching, is essential for viability in Schizosaccharomyces pombe. Mol. Cell. Biol. 14:2058-2065. - PMC - PubMed
    1. Arcangioli, B., M. Ghazvini, and V. Ribes. 1994. Identification of the DNA-binding domains of the switch-activating-protein Sap1 from S. pombe by random point mutations screening in E. coli. Nucleic Acids Res. 22:2930-2937. - PMC - PubMed
    1. Arcangioli, B., and A. J. Klar. 1991. A novel switch-activating site (SAS1) and its cognate binding factor (SAP1) required for efficient mat1 switching in Schizosaccharomyces pombe. EMBO J. 10:3025-3032. - PMC - PubMed
    1. Bada, M., D. Walther, B. Arcangioli, S. Doniach, and M. Delarue. 2000. Solution structural studies and low-resolution model of the Schizosaccharomyces pombe sap1 protein. J. Mol. Biol. 300:563-574. - PubMed

Publication types

MeSH terms

LinkOut - more resources