. 2006 Nov;26(21):7913-28.
doi: 10.1128/MCB.01220-06. Epub 2006 Aug 28.

Negative and positive regulation of gene expression by mouse histone deacetylase 1

Affiliations

Negative and positive regulation of gene expression by mouse histone deacetylase 1

Gordin Zupkovitz et al. Mol Cell Biol. 2006 Nov.

Abstract

Histone deacetylases (HDACs) catalyze the removal of acetyl groups from core histones. Because of their capacity to induce local condensation of chromatin, HDACs are generally considered repressors of transcription. In this report, we analyzed the role of the class I histone deacetylase HDAC1 as a transcriptional regulator by comparing the expression profiles of wild-type and HDAC1-deficient embryonic stem cells. A specific subset of mouse genes (7%) was deregulated in the absence of HDAC1. We identified several putative tumor suppressors (JunB, Prss11, and Plagl1) and imprinted genes (Igf2, H19, and p57) as novel HDAC1 targets. The majority of HDAC1 target genes showed reduced expression accompanied by recruitment of HDAC1 and local reduction in histone acetylation at regulatory regions. At some target genes, the related deacetylase HDAC2 partially masks the loss of HDAC1. A second group of genes was found to be downregulated in HDAC1-deficient cells, predominantly by additional recruitment of HDAC2 in the absence of HDAC1. Finally, a small set of genes (Gja1, Irf1, and Gbp2) was found to require HDAC activity and recruitment of HDAC1 for their transcriptional activation. Our study reveals a regulatory cross talk between HDAC1 and HDAC2 and a novel function for HDAC1 as a transcriptional coactivator.


Figures
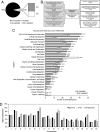
FIG. 1.
FIG. 1.
DNA array analysis of wild-type versus HDAC1-deficient ES cell lines. (A) Summary of DNA array results. Total numbers of genes found on Affymetrix GeneChip Mu74 microarray analysis are presented as nonregulated (black) and deregulated (light gray) genes. The dark gray bar represents the number of positively regulated genes, and the white bar represents the number of negatively regulated genes in HDAC1-deficient ES cells. (B) Molecular networks of putative HDAC1 target genes. Putative HDAC1 target genes were overlaid onto a global molecular network developed from information contained in the Ingenuity Pathways Knowledge Base. Networks of putative HDAC1 target genes were then algorithmically generated based on their connectivity. The networks are ranked according to their scores, and the five highest-ranking networks of upregulated and downregulated genes are displayed. The numbers of genes in each network are shown in brackets. (C) Functional classification of HDAC1 target genes. The probe sets corresponding to all deregulated transcripts were analyzed using Ingenuity Pathways Analysis (Ingenuity Systems) for molecular and cellular functions. Different categories are ranked according to the numbers of associated genes. Gray bars represent genes that are upregulated in HDAC1 KO cells, and white bars represent genes that are downregulated in HDAC1 KO cells. The probability that each biological function and/or disease assigned to the data set is due to chance alone is indicated as a P value for each category (shown on the right-hand side of each bar). (D) Chromosomal distribution of deregulated genes. Black bars, total numbers of genes on the indicated chromosomes relative to the total number of genes in the mouse genome; white bars, numbers of genes on the indicated chromosomes present on the array relative to the total number of genes present on the array; gray bars, numbers of deregulated genes on the indicated chromosomes relative to the total number of deregulated genes. Chromosomes X and Y are excluded, since the cell lines were of opposite sexes.
FIG. 2.
FIG. 2.
Validation of the DNA array screen. (A) SYBR green real-time RT-PCR analysis of upregulated genes. Total RNA isolated from wild-type (WT) and HDAC1-deficient ES cells was reverse transcribed, and PCR was performed with primers specific for the cDNA of indicated genes. Gene expression levels were normalized to tubulin α1 levels and shown as expression levels in HDAC1-null cells relative to expression levels in wild-type cells (arbitrarily set to 1). (B) SYBR green real-time RT-PCR analysis of downregulated genes. The analysis was performed as described for panel A.
FIG. 3.
FIG. 3.
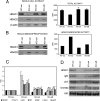
The deregulation of HDAC1 target genes in HDAC1-null cells is reversible. (A) Whole-cell extracts were prepared from two different clones of HDAC1-transfected KO ES cells (KO-reA and KO-reB) and respective wild-type (WT-vec) and KO (KO-vec) controls. Extracts were analyzed for expression of HDAC1, HDAC2, and β-actin on a Western blot (left panel) and for deacetylase activity as described in Materials and Methods (right panel). Data presented for relative HDAC activities per hour per 10 μg protein are mean values for three independent experiments. (B) Equal amounts of the extracts described in panel A were precipitated with HDAC2-specific antibodies, and the immunoprecipitates were examined for the presence of HDAC1 and HDAC2 (left panel) and associated deacetylase activity (right panel). Data presented are representative of three independent experiments. (C) SYBR green real-time RT-PCR analysis of mRNA expression in the cell lines described for panel A. Gene expression levels were normalized to tubulin α1 levels and are shown relative to expression levels in the wild-type control. Data presented are mean values for three independent experiments. (D) Northern blot analysis of total RNA isolated from the same cells as used for panel A probed with cDNA fragments of the indicated genes. Methylene blue staining of 18S RNA illustrates the equal loading of the samples.
FIG. 4.
FIG. 4.
Expression of an enzymatically inactive HDAC1 mutant induces a subset of HDAC1 target genes. (A) Left panel, Western blot analysis of whole-cell extracts prepared from HDAC1-H140/141A mutant-expressing HDAC1 KO cells (KO-mut) and respective wild-type (WT-vec) and KO (KO-vec) controls. The blot was incubated sequentially with antibodies specific for HDAC1, HDAC2, and β-actin, respectively. Right panel, equal amounts of the extracts described for the left panel were analyzed for total deacetylase activity. Data presented for relative HDAC activities are mean values for three independent experiments. (B) Left panel, Western blot analysis of HDAC2 immunoprecipitates prepared from the protein extracts described for panel A with antibodies specific for HDAC1 and HDAC2. Right panel, comparison of HDAC2-associated deacetylase activities after immunoprecipitation with an HDAC2-specific antibody from the whole-cell extracts described for panel A. Data presented are representative of three independent experiments. (C) SYBR green real-time RT-PCR analysis of target genes. Total RNA isolated from KO-mut cells and vector-transfected KO cells was analyzed by quantitative RT-PCR for the expression of the indicated genes. Expression levels (n-fold) were normalized to expression levels in KO-vec cells and presented as mean values for three experiments.
FIG. 5.
FIG. 5.
TSA positively regulates the expression of potential HDAC1 target genes. SYBR green real-time RT-PCR analysis of wild-type (WT) and KO ES cells treated for 12 h with DMSO or 5, 10, 20, and 40 ng/ml (16.5, 33.1, 66.1, and 132.3 nM, respectively) of TSA. Target gene expression levels, normalized to tubulin α1 expression levels, are shown relative to expression levels in DMSO-treated wild-type cells (arbitrarily set to 1). The data presented are mean values for three independent experiments.
FIG. 6.
FIG. 6.
Absence of HDAC1 on the regulatory regions of target genes is associated with hyperacetylation of histones. Formaldehyde-cross-linked chromatin from wild-type (WT) and HDAC1 KO cells was immunoprecipitated with control (con), HDAC1, HDAC2, acetylated H3 (AcH3), acetylated H4 (AcH4), acetylated lysine 9 H3 (AcK9H3), trimethylated lysine 9 H3 (3MeK9H3), trimethylated lysine 27 H3 (3MeK27H3), and C-terminal H3 antibodies (cH3). DNA isolated from immunoprecipitated fractions and total input chromatin was analyzed by semiquantitative PCR specific for the indicated regions. These results are representative of three independent experiments.
FIG. 7.
FIG. 7.
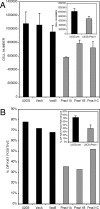
The HDAC1 target gene Prss1 gene negatively affects proliferation in human tumor cells. (A) Equal numbers (120,000) of untransfected, empty-vector-transfected (VecA and VecB), and Prss11-overexpressing (Prss11A, Prss11B, and Prss11C) U2OS cells were plated in triplicate on 10-cm dishes. Cell numbers were determined after 3 days by using a Casy cell counter. The insert shows mean values for three vector-transfected cell lines (U2OS+vec) and three Prss11-overexpressing cell lines (U2OS+Prss11). (B) Ki67 staining of the same cell lines as used for panel A. Ki67 was visualized by indirect fluorescence microscopy, and nuclear DNA was stained with DAPI. Data are presented as percentages of Ki67-positive cells per 100 counted cells. The insert shows mean values for Ki67-positive cells for cell lines transfected with empty-vector (U2OS+vec) and Prss11-overexpressing (U2OS+Prss11) cell lines.
FIG. 8.
FIG. 8.
Positive impact of HDAC1 on the expression of a subset of target genes. (A) Real-time RT-PCR analysis of the expression of Edg1, Efnb2, Ehd1, and Gja1 in wild-type (WT) and HDAC1 KO ES cells upon treatment for 12 h with solvent (DMSO) or different concentrations of TSA. Normalized gene expression levels are shown relative to expression levels in DMSO-treated cells. (B) ChIP analysis of the Edg1 and Gja1 promoters in wild-type and HDAC1 KO cells. Formaldehyde-cross-linked chromatin was immunoprecipitated with control antibodies (con) or antibodies specific for HDAC1, HDAC2, acetylated H3 (AcH3), acetylated H4 (AcH4), or the C terminus of histone H3 (cH3). DNA isolated from immunoprecipitated material was analyzed by semiquantitative PCR with primers specific for the respective promoter regions. These results are representative of three independent experiments.
FIG. 9.
FIG. 9.
HDAC1 activity is required for the induction of specific IFN target genes in ES cells. (A) Real-time RT-PCR analysis of the expression of Irf1 and Gbp2 in wild-type (WT) and HDAC1 KO ES cells. Cells were treated for 1 h with solvent (mock) or with 10 μg/ml IFN-γ (IFNγ), 20 ng/ml (33.1 nM) TSA alone (TSA), or IFN-γ and TSA together (IFN+TSA). Expression levels of Irf1 and Gbp2 were normalized to tubulin α1 levels and are shown relative to the expression levels in wild-type ES cells. Data presented are mean values for three independent experiments. (B) Presence of HDAC1 and hypoacetylation of histone H4 on Irf1 promoter are associated with its IFN-γ induction. Formaldehyde-cross-linked chromatin from wild-type and HDAC1 KO ES cells treated as described for panel A was immunoprecipitated with control antibodies (con) or antibodies specific for HDAC1, acetyl-H3 (AcH3), acetyl-H4 (AcH4), or the C terminus of histone H3 (cH3). DNA isolated from immunoprecipitated fractions was analyzed by semiquantitative PCR specific for proximal promoter regions of the Irf1 (left) and Gbp2 (right) genes.

Similar articles

Cited by

References

    1. Abdollahi, A., D. Pisarcik, D. Roberts, J. Weinstein, P. Cairns, and T. C. Hamilton. 2003. LOT1 (PLAGL1/ZAC1), the candidate tumor suppressor gene at chromosome 6q24-25, is epigenetically regulated in cancer. J. Biol. Chem. 278:6041-6049. - PubMed
    1. Ahringer, J. 2000. NuRD and SIN3 histone deacetylase complexes in development. Trends Genet. 16:351-356. - PubMed
    1. Allfrey, V. G., R. Faulkner, and A. E. Mirsky. 1964. Acetylation and methylation of histones and their possible role in the regulation of RNA synthesis. Proc. Natl. Acad. Sci. USA 51:786-794. - PMC - PubMed
    1. Baldi, A., A. De Luca, M. Morini, T. Battista, A. Felsani, F. Baldi, C. Catricala, A. Amantea, D. M. Noonan, A. Albini, P. G. Natali, D. Lombardi, and M. G. Paggi. 2002. The HtrA1 serine protease is down-regulated during human melanoma progression and represses growth of metastatic melanoma cells. Oncogene 21:6684-6688. - PubMed
    1. Bartl, S., J. Taplick, G. Lagger, H. Khier, K. Kuchler, and C. Seiser. 1997. Identification of mouse histone deacetylase 1 as a growth factor-inducible gene. Mol. Cell. Biol. 17:5033-5043. - PMC - PubMed

Publication types

MeSH terms