Transgene insertion in proximity to the c-myb gene disrupts erythroid-megakaryocytic lineage bifurcation
- PMID: 16940183
- PMCID: PMC1636724
- DOI: 10.1128/MCB.00718-06
Transgene insertion in proximity to the c-myb gene disrupts erythroid-megakaryocytic lineage bifurcation
Abstract
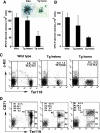
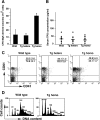
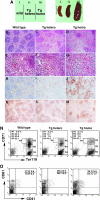
The nuclear proto-oncogene c-myb plays crucial roles in the growth, survival, and differentiation of hematopoietic cells. We established three lines of erythropoietin receptor-transgenic mice and found that one of them exhibited anemia, thrombocythemia, and splenomegaly. These abnormalities were independent of the function of the transgenic erythropoietin receptor and were observed exclusively in mice harboring the transgene homozygously, suggesting transgenic disruption of a certain gene. The transgene was inserted 77 kb upstream of the c-myb gene, and c-Myb expression was markedly decreased in megakaryocyte/erythrocyte lineage-restricted progenitors (MEPs) of the homozygous mutant mice. In the bone marrows and spleens of the mutant mice, numbers of megakaryocytes were increased and numbers of erythroid progenitors were decreased. These abnormalities were reproducible in vitro in a coculture assay of MEPs with OP9 cells but eliminated by the retroviral expression of c-Myb in MEPs. The erythroid/megakaryocytic abnormalities were reconstituted in mice in vivo by transplantation of mutant mouse bone marrow cells. These results demonstrate that the transgene insertion into the c-myb gene far upstream regulatory region affects the gene expression at the stage of MEPs, leading to an imbalance between erythroid and megakaryocytic cells, and suggest that c-Myb is an essential regulator of the erythroid-megakaryocytic lineage bifurcation.
Figures


Similar articles
-
Regulation of gene transcription during the differentiation of megakaryocytes.Thromb Haemost. 1995 Jul;74(1):210-2. Thromb Haemost. 1995. PMID: 8578459 Review.
-
Impairment of erythroid and megakaryocytic differentiation by a leukemia-associated and t(9;9)-derived fusion gene product, SET/TAF-Ibeta-CAN/Nup214.J Cell Physiol. 2008 Feb;214(2):322-33. doi: 10.1002/jcp.21199. J Cell Physiol. 2008. PMID: 17620317
-
AML-1 is required for megakaryocytic maturation and lymphocytic differentiation, but not for maintenance of hematopoietic stem cells in adult hematopoiesis.Nat Med. 2004 Mar;10(3):299-304. doi: 10.1038/nm997. Epub 2004 Feb 15. Nat Med. 2004. PMID: 14966519
-
Overexpression of Ets-1 in human hematopoietic progenitor cells blocks erythroid and promotes megakaryocytic differentiation.Cell Death Differ. 2006 Jul;13(7):1064-74. doi: 10.1038/sj.cdd.4401811. Epub 2005 Nov 18. Cell Death Differ. 2006. PMID: 16294212
-
[Research progress of proto-oncogene c-myb in megakaryocyte-erythroid hematopoiesis].Zhongguo Shi Yan Xue Ye Xue Za Zhi. 2012 Apr;20(2):518-22. Zhongguo Shi Yan Xue Ye Xue Za Zhi. 2012. PMID: 22541131 Review. Chinese.
Cited by
-
NF-E2 domination over Nrf2 promotes ROS accumulation and megakaryocytic maturation.Blood. 2010 Jan 21;115(3):677-86. doi: 10.1182/blood-2009-05-223107. Epub 2009 Nov 9. Blood. 2010. PMID: 19901266 Free PMC article.
-
Primitive erythropoiesis and megakaryopoiesis in the yolk sac are independent of c-myb.Blood. 2008 Mar 1;111(5):2636-9. doi: 10.1182/blood-2007-11-124685. Epub 2008 Jan 3. Blood. 2008. PMID: 18174377 Free PMC article.
-
Regulation of Hemogenic Endothelial Cell Development and Function.Annu Rev Physiol. 2021 Feb 10;83:17-37. doi: 10.1146/annurev-physiol-021119-034352. Epub 2020 Oct 9. Annu Rev Physiol. 2021. PMID: 33035429 Free PMC article. Review.
-
Transcriptional activities of human elongation factor-1α and cytomegalovirus promoter in transgenic dogs generated by somatic cell nuclear transfer.PLoS One. 2020 Jun 3;15(6):e0233784. doi: 10.1371/journal.pone.0233784. eCollection 2020. PLoS One. 2020. PMID: 32492024 Free PMC article.
-
The ovarian cancer oncobiome.Oncotarget. 2017 May 30;8(22):36225-36245. doi: 10.18632/oncotarget.16717. Oncotarget. 2017. PMID: 28410234 Free PMC article.
References
-
- Akashi, K., D. Traver, T. Miyamoto, and I. L. Weissman. 2000. A clonogenic common myeloid progenitor that gives rise to all myeloid lineages. Nature 404:193-197. - PubMed
-
- Barr, N. I., M. Stewart, C. Tsatsanis, R. Fulton, M. Hu, H. Tsujimoto, and J. C. Neil. 1999. The fit-1 common integration locus in human and mouse is closely linked to MYB. Mamm. Genome 10:556-559. - PubMed
-
- Carpinelli, M. R., D. J. Hilton, D. Metcalf, J. L. Antonchuk, C. D. Hyland, S. L. Mifsud, L. D. Rago, A. A. Hilton, T. A. Willson, A. W. Roberts, R. G. Ramsay, N. A. Nicola, and W. S. Alexander. 2004. Suppressor screen in Mpl−/− mice: c-Myb mutation causes supraphysiological production of platelets in the absence of thrombopoietin signaling. Proc. Natl. Acad. Sci. USA 101:6553-6558. - PMC - PubMed
-
- Friedman, A. D. 2002. Runx1, c-Myb, and C/EBP alpha couple differentiation to proliferation or growth arrest during hematopoiesis. J. Cell. Biochem. 86:624-629. - PubMed
Publication types
MeSH terms
Substances
LinkOut - more resources
Full Text Sources
Other Literature Sources
Molecular Biology Databases
