. 2006 Dec 15;108(13):4126-35.
doi: 10.1182/blood-2006-04-017046. Epub 2006 Aug 29.

Selective leukemic-cell killing by a novel functional class of thalidomide analogs

Affiliations

Selective leukemic-cell killing by a novel functional class of thalidomide analogs

Yun Ge et al. Blood. .

Abstract

Using a novel cell-based assay to profile transcriptional pathway targeting, we have identified a new functional class of thalidomide analogs with distinct and selective antileukemic activity. These agents activate nuclear factor of activated T cells (NFAT) transcriptional pathways while simultaneously repressing nuclear factor-kappaB (NF-kappaB) via a rapid intracellular amplification of reactive oxygen species (ROS). The elevated ROS is associated with increased intracellular free calcium, rapid dissipation of the mitochondrial membrane potential, disrupted mitochondrial structure, and caspase-independent cell death. This cytotoxicity is highly selective for transformed lymphoid cells, is reversed by free radical scavengers, synergizes with the antileukemic activity of other redox-directed compounds, and preferentially targets cells in the S phase of the cell cycle. Live-cell imaging reveals a rapid drug-induced burst of ROS originating in the endoplasmic reticulum and associated mitochondria just prior to spreading throughout the cell. As members of a novel functional class of "redoxreactive" thalidomides, these compounds provide a new tool through which selective cellular properties of redox status and intracellular bioactivation can be leveraged by rational combinatorial therapeutic strategies and appropriate drug design to exploit cell-specific vulnerabilities for maximum drug efficacy.


Figures

Figure 1.
Figure 1.
Transcriptional pathway profiling in human T cells reveals a novel functional class of thalidomide analogs. (A) Chemical structures of thalidomide compounds profiled in this study. (B) The transcriptional targeting of thalidomide (100 μM), CPS11, CPS45, CPS49, cc5013 (Revlimid; lenalidomide), cc4001 (rolipram), and cc4047 (Actimid) (10 μM each) were profiled by high-throughput transfection using the indicated luciferase-based reporters (columns) stimulated by 16 different combinations of T-cell mitogens (rows; key defines numbers). Concentrations of the mitogens used were 50 ng/mL PMA, 720 ng/mL Ion, 1:1000 dilution of anti-CD3 antibody, and 1:1000 dilution of anti-CD28 monoclonal antibody. The transcriptional output was analyzed by hierarchical clustering applying a Euclidian distance metric. Color intensities from green to red are based on percentage of maximum stimulation. (C) PCA shows a separation of CPS45, CPS49, and CPS11 from the other thalidomide compounds along PC1. (D) Percentage variation in the transcriptional data captured by the different principal components. x-axis denotes the PCs; y-axis indicates the amount of variance captured by each PC (black), with cumulative variance shown in blue.
Figure 2.
Figure 2.
Preferential pattern of NFAT and NF-κB transcriptional pathway targeting by CPS11, CPS45, and CPS49. (A) Plotting of the magnitude (y-axis) of the Eigenvector coefficients (x-axis) derived from PC1 reveals strong anticorrelated contribution from NF-κB and NFAT pathways. (B) PCA of the drug influence on each of the 16 mitogen-induced transcriptional responses mapped by biplot analysis. Ellipses enclose 2 SDs from the mean effect of each drug group. (C) Histogram analysis of the drug-influenced NFAT and NF-κB reporter activity. Stimulation conditions are indicated by number assignment in the key. Results are representative of triplicate determinations. The average percentage of error for the transfections was 6.6%.
Figure 3.
Figure 3.
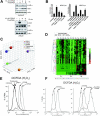
CPS11, CPS45, and CPS49 thalidomide analogs inhibit NF-κB, activate NFAT, and repress cytokine expression through elevated ROS. (A) Top panel shows immunoblot of phospho-IκBα, IκBα, and actin in the cytosol of Jurkat cells stimulated with PHA/PMA for 1 hour in the presence or absence of 10 μM CPS45. Bottom panel shows immunoblot of phospho-IκBα,IκBα, phospho-RelA, and RelA in whole-cell extracts (WCE) of Jurkat cells preincubated for 15 minutes with 10 μM CPS45 prior to stimulation with PHA/PMA for 15 minutes. (B) CPS45 (10 μM) stimulation of NFAT-mediated transactivation alone or in the presence of PHA/PMA, cyclosporin A, or both combined. Data are an average of triplicate measurements and each is representative of at least 2 independent experiments. Error bars indicate standard error of the mean (SEM). (C) PCA of the dose- and time-dependent influence of thalidomide, CPS11, CPS45, and CPS49 on mitogen-induced secretion of GM-CSF, IL-1β, IL-2, IL-4, IL-5, IL-6, IL-8, IL-10, IL-12p70, and TNF-α in Jurkat cells (mitogen list is in Figure 1B). (D) Hierarchical clustering comparison of the dose- and time-dependent influence of thalidomide, CPS11, CPS45, and CPS49 on the mitogen-induced cytokine secretion pattern of Jurkat cells. (E) FACS profile of cells loaded with the oxidation-sensitive dye DCFDA and treated with either 10 μM thalidomide, CPS11, CPS45, or CPS49 for 60 minutes. Percentages of maximum cell counts are plotted against fluorescence intensity. (F) FACS profile of the levels of ROS generated after 45 minutes of treatment with 10 μM CPS45 (left panel) compared with cells treated with PHA/PMA alone or PHA/PMA and CPS45 combined (right panel).
Figure 4.
Figure 4.
CPS45 induces rapid caspase-independent cell death reversed by antioxidants. (A) FACS measurement of 10 μM CPS45–induced cell death by annexin and PI staining after 0 to 3 hours of drug exposure. Percentages indicate percentage of cells in the respective quadrants. (B) FACS analysis of the reversal of cell killing by the broad-spectrum caspase inhibitor z-VAD (200 μM), 5 μM ebselen, 20 mM NAC, 10 μM DPI, or 50 μM MnTBAP. Changes are shown as a percentage of maximum PI-positive cells in the presence of 10 μM CPS45 alone. (C) Kinetic profile of ROS generation, intracellular calcium elevation, and loss of mitochondrial membrane potential at 15-minute intervals during 1 hour of treatment with 10 μM CPS45. Data represents means of triplicate determinations normalized to the percentage of maximum. (D) Immunoblot analysis of caspase 7 (nuclear and cytosolic), caspase 3 (nuclear), and PARP (nuclear) cleavage in PHA/PMA-stimulated Jurkat cells untreated or treated for 8 hours with 10 μM CPS45. Arrows indicate activated caspase cleavage products.
Figure 5.
Figure 5.
CPS45 shows selective redox-dependent killing of transformed leukemic cells and acts in synergy with parthenolide to promote cell death. (A) Jurkat cells (left panels) and donor PBMCs (right panels) were incubated with increasing concentrations of CPS11, CPS45, CPS49 (1 nM-10 μM), and thalidomide (1 nM-200 μM). Viability was measured after 8, 16, and 32 hours of incubation by MTT assay. (B) Jurkat (left panels) and donor PBMCs (right panels) were incubated with either 5 μM CPS45 (top row) or CPS49 (bottom row) alone or with 20 and 40 μM NAC. Viability was determined after 8 hours. (C) PBMCs, PBMC blasts, and 15 different transformed cell lines (Table S1) were treated with increasing doses of CPS45 for 16 hours. Viability was determined by MTT and analyzed by hierarchical clustering (Euclidean distance, average linkage). (D) HeLa cells were preincubated with 0, 25, or 50 μM BSO for 24 hours prior to treatment with the indicated concentration of CPS45 for 16 hours. (E) Left panel shows Jurkat cells were incubated with increasing concentrations (31.25 nM-2 μM) of CPS45 and parthenolide at a fixed ratio (1:2.5) for 24 hours. Viability was measured by MTT assay and CI values for each fractional effect (right panel) were calculated using commercially available software (Calcusyn; Biosoft). CI values less than 1.0 correspond to synergistic interactions. Error bars represent SEM.
Figure 6.
Figure 6.
Dose-dependent elevation of intracellular ROS by CPS45 is cell specific and shows preferential targeting of cells in S phase. (A) Comparison of dose-dependent killing of the mouse L1210 leukemia cell line by CPS45 and thalidomide. (B) Profile of cell and dose-dependent elevation of intracellular ROS (DCFDA fluorescence) in Jurkat, L1210, and HeLa cells treated with increasing concentrations of CPS45 (1 nM-10 μM) or thalidomide (1 nM-200 μM). (C) L1210 cells synchronized in G1, S, and G2 phases of the cell cycle by centrifugal elutriation (top panel) were treated with increasing doses of CPS45 (1 nM-10 μM) for 16 hours. Viability of cells at each stage of the cell cycle was determined by MTT assay (bottom panel). Shown are the results of 2 independent experiments. Error bars represent SEM.
Figure 7.
Figure 7.
ROS develop within minutes in an intracellular compartment in CPS45-treated leukemic cells and selectively cause damage to the mitochondria of leukemic cells. (A) Jurkat T cells were bound to poly-lysine–coated slides and preincubated with the oxidation-sensitive fluorescent dye DCFDA; fluorescence was captured by live-cell imaging on a Zeiss 510 confocal microscope (Carl Zeiss, Oberkochen, Germany) using a 100×/1.3 NA oil objective at 10-second intervals from 0 to 36 minutes after the addition of 10 μM CPS45. Captured images were annotated using Adobe Photoshop (Adobe, San Jose, CA). Arrows indicate intracellular origin of ROS in the region of the ER and associated mitochondria (Video S1). (B) Electron microscopic (EM) images of Jurkat cells (top left) and PBMCs (bottom left and bottom right) treated with 10 μM CPS45 for 4 hours. Higher magnification of Jurkat cells treated for 1 hour with CPS 10 μM 45 (top right) contrasted against PBMCs treated for 4 hours with 10 μM CPS45 (bottom right). Scale bar equals 0.5 or 2.5 μm as indicated. Arrowheads indicate mitochondria. (C) Schematic representation of the proposed mechanism of CPS45-induced cell death in leukemic cells. Entry of CPS45 initiates a cascade of molecular events beginning with elevation of ROS that originates in the ER and mitochondrial (Mito) compartment. The elevated ER stress leads to elevated calcium and subsequent NFAT induction. The ROS-induced action at the mitochondria is self-amplifying. These events culminate in mitochondrial dysfunction, elevation of stress-response genes, and cell death.

Similar articles

Cited by

References

    1. Franks ME, Macpherson GR, Figg WD. Thalidomide. Lancet. 2004;363: 1802-1811. - PubMed
    1. Bartlett JB, Dredge K, Dalgleish AG. The evolution of thalidomide and its IMiD derivatives as anticancer agents. Nat Rev Cancer. 2004;4: 314-322. - PubMed
    1. Teo SK, Resztak KE, Scheffler MA, et al. Thalidomide in the treatment of leprosy. Microbes Infect. 2002;4: 1193-1202. - PubMed
    1. Moreira AL, Sampaio EP, Zmuidzinas A, et al. Thalidomide exerts its inhibitory action on tumor necrosis factor alpha by enhancing mRNA degradation. J Exp Med. 1993;177: 1675-1680. - PMC - PubMed
    1. Haslett PA, Corral LG, Albert M, Kaplan G. Thalidomide costimulates primary human T lymphocytes, preferentially inducing proliferation, cytokine production, and cytotoxic responses in the CD8+ subset. J Exp Med. 1998;187: 1885-1892. - PMC - PubMed

Publication types

MeSH terms