Comparative Study
. 2007 Jan 1;109(1):219-27.
doi: 10.1182/blood-2006-03-007153. Epub 2006 Aug 29.

Human galectin-1, -2, and -4 induce surface exposure of phosphatidylserine in activated human neutrophils but not in activated T cells

Affiliations
Comparative Study

Human galectin-1, -2, and -4 induce surface exposure of phosphatidylserine in activated human neutrophils but not in activated T cells

Sean R Stowell et al. Blood. .

Abstract

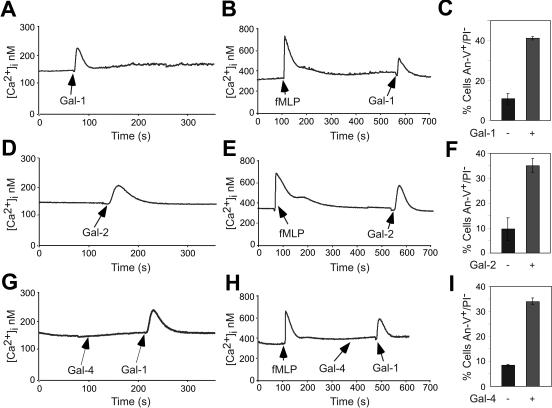
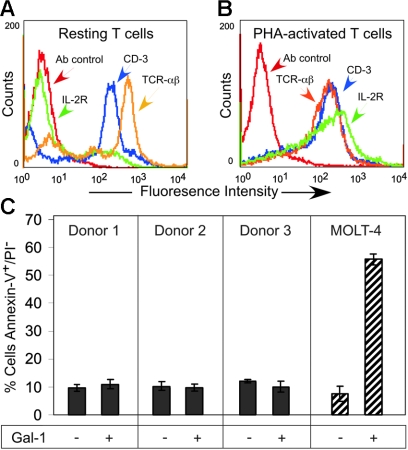
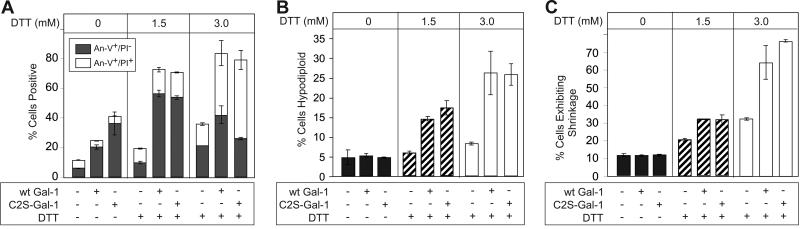
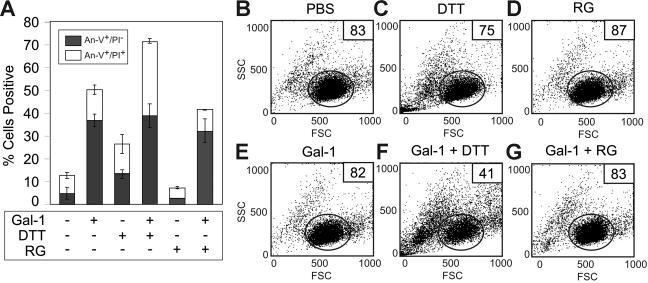
Cellular turnover is associated with exposure of surface phosphatidylserine (PS) in apoptotic cells, leading to their phagocytic recognition and removal. But recent studies indicate that surface PS exposure is not always associated with apoptosis. Here we show that several members of the human galectin family of glycan binding proteins (galectins-1, -2, and -4) induce PS exposure in a carbohydrate-dependent fashion in activated, but not resting, human neutrophils and in several leukocyte cell lines. PS exposure is not associated with apoptosis in activated neutrophils. The exposure of PS in cell lines treated with these galectins is sustained and does not affect cell viability. Unexpectedly, these galectins bind well to activated T lymphocytes, but do not induce either PS exposure or apoptosis, indicating that galectin's effects are cell specific. These results suggest novel immunoregulatory contribution of galectins in regulating leukocyte turnover independently of apoptosis.


Conflict of interest statement

Conflict of interest disclosure: The authors declare no competing financial interests.

Figures

Figure 1
Figure 1
Gal-2 and Gal-4 induced PS exposure in MOLT-4 and HL60 cells. (A) MOLT-4 cells were incubated with ALEXA 488–Gal-2, and (B) HL60 cells were incubated with ALEXA 488–Gal-4, followed by flow cytometric analysis. NANase indicates prior treatment of cells with A urefaciens neuraminidase (100 mU) for 1 hour at 37°C. (C-D) HL60 cells or MOLT-4 cells were incubated with either 10 μM Gal-2 (C) or 3 μM Gal-4 (D) for 4 hours followed by flow cytometric analysis for PS externalization. NANase indicates prior treatment of cells with A urefaciens neuraminidase (100 mU) for 1 hour at 37°C. Error bars represent the standard deviation of duplicate samples.
Figure 2
Figure 2
Kinetics and concentration dependence of Gal-2– and Gal-4–induced PS exposure. (A) Desialylated HL60 cells (dsHL60) cells were incubated with 3 μM Gal-4 or 10 μM Gal-2 for the indicated times followed by detection of PS externalization. Control indicates the inclusion of PBS alone. (B) dsHL60 cells were incubated with Gal-2 or Gal-4 at each indicated concentration for 4 hours followed by detection for PS externalization. Results shown are the averages of duplicate analyses and are representative of at least 2 separate experiments. Error bars indicate the standard deviation of duplicate samples.
Figure 3
Figure 3
Galectins induce PS exposure in cell lines without accompanying apoptosis. Representative histograms of dsHL60 cells treated with PBS (A), 10 μM Gal-2 (B), or 20 μM camptothecin (C) for 18 hours followed by flow cytometric analysis for DNA degradation (TUNEL assay). Error bars represent the standard deviation of duplicate samples. The dsMOLT-4 or dsHL60 cells were treated with 5 μM Gal-4 (D), 10 μM Gal-2 (E), or 20 μM topoisomerase inhibitors (etoposide for MOLT-4 cells or camptothecin for HL60 cells) for 18 hours followed by flow cytometric analysis for DNA degradation (TUNEL assay). The dsMOLT-4 cells (F) or dsHL60 cells (G) were treated with either 3 μM Gal-4 or 20 μM topoisomerase inhibitors (etoposide for MOLT-4 cells or camptothecin for HL60) for the indicated times followed by the determination of viable cell number by trypan blue exclusion using a hemocytometer. Results shown are the averages of duplicate analyses and are representative of at least 2 separate experiments. Error bars represent the standard deviation of duplicate samples. Representative dot plots for dsHL60 cells treated with PBS (H), 10 μM Gal-2 (I), or 20 μM camptothecin (J) for 18 hours followed by flow cytometric analysis for changes in the light-scattering properties of the cells. Gate values of cells experiencing no changes in forward- and side-scatter profile are shown.
Figure 4
Figure 4
Galectins induce PS exposure in fMLP-activated human neutrophils. (A) fMLP-activated or resting neutrophils were treated with either PBS, 3 μM Gal-4, or 3 μM Gal-4 plus 30 mM TDG for 4 hours, as indicated, followed by analysis of PS exposure using annexin-V. (B) fMLP-activated neutrophils were incubated with either 10 μM Gal-1, 10 μM Gal-2, 3 μM Gal-4, or 100 ng/mL anti-Fas for 8 hours followed by detection for PS exposure. (C) fMLP-activated neutrophils were incubated with either 10 μM Gal-1, 10 μM Gal-2, 3 μM Gal-4, or 100 ng/mL anti-Fas for 8 hours followed by detection for DNA degradation (TUNEL assay). (D) fMLP-activated neutrophils were incubated with either 10 μM Gal-1, 10 μM Gal-2, 3 μM Gal-4, or 100 ng/mL anti-Fas for 8 hours followed by flow cytometric analysis for the percentage of cells exhibiting shrinkage. Results shown are the averages of duplicate analyses and are representative of at least 2 separate experiments. Error bars represent the standard deviation of duplicate samples.
Figure 5
Figure 5
Gal-1 and Gal-2 but not Gal-4 induce Ca2+ flux in both resting and activated neutrophils. Resting neutrophils were treated with 10 μM Gal-1 (A), 10 μM Gal-2 (D), or 5 μM Gal-4 followed by 10 μM Gal-1 (G), followed by detection for changes in intracellular Ca2+ levels. Resting neutrophils were activated with fMLP followed by treatment with either 10 μM Gal-1 (B), 10 μM Gal-2 (E), or 5 μM Gal-4 followed by 10 μM Gal-1 (H), followed by detection for changes in intracellular Ca2+ levels. fMLP-activated neutrophils in parallel assays were treated with 10 μM Gal-1 (C), 10 μM Gal-2 (F), or 5 μM Gal-4 (I) for 4 hours followed by detection of PS exposure. Error bars represent the standard deviation of duplicate samples.
Figure 6
Figure 6
Gal-1 does not induce PS exposure in activated human T cells. (A-B) Resting T cells (A) or PHA-activated T cells (B) were incubated with anti–IL-2R, anti–CD-3, anti–TCR-αβ, or isotype control followed by flow cytometric analysis. (C) PHA-activated T cells isolated from 3 separate donors as indicated or MOLT-4 cells were treated with 10 μM Gal-1 followed by detection for PS exposure. Error bars represent the standard deviation of duplicate samples.
Figure 7
Figure 7
DTT primes activated human T cells for Gal-1–induced PS exposure. (A) PHA-activated T cells were incubated with RPMI alone, 10 μM Gal-1 alone, or with the respective concentration of DTT with or without 10 μM Gal-1 for 9 hours as indicated, followed by the detection for PS exposure. (B) HL60 cells were treated with either freshly prepared C2S-Gal-1 or C2S-Gal-1 incubated for 24 hours in the absence of DTT. Following C2S-Gal-1 addition, cells were incubated for 4 hours followed by analysis for PS exposure. (C) PHA-activated T cells or MOLT-4 cells were incubated with 10 μM Gal-1 or 10 μM C2S-Gal-1 with or without 1.2 mM DTT for 9 hours, followed by detection for PS exposure. (D) PHA-activated T cells or MOLT-4 cells were incubated with 10 μM C2S-Gal-1 with or without 30 mM TDG as indicated for 9 hours followed by detection for PS exposure. Error bars represent the standard deviation of duplicate samples.
Figure 8
Figure 8
Gal-2 and Gal-4 do not induce PS exposure in activated T cells. (A) PHA-activated T cells or MOLT-4 cells were incubated with 10 μM Gal-2 or 3 μM Gal-4 for 9 hours in the absence of DTT, followed by detection for PS exposure. (B) Gal-4 or C2S-Gal-1 was incubated without DTT for the indicated time followed by treatment of HL60 cells for 4 hours and detection for PS exposure. Error bars represent the standard deviation of duplicate samples.
Figure 9
Figure 9
DTT primes MOLT-4 cells for Gal-1–induced apoptosis. (A) MOLT-4 cells were incubated with either 10 μM wt Gal-1 or 10 μM C2S-Gal-1 with or without DTT at the concentrations indicated for 8 hours, followed by analysis for PS exposure (annexin-V+/PI) and membrane integrity loss (annexin-V+/PI+). (B) MOLT-4 cells were incubated with either 10 μM wt Gal-1 or 10 μM C2S-Gal-1 with or without DTT at the concentrations indicated for 8 hours, followed by analysis for DNA degradation by assaying for hypodiploid DNA content by flow cytometry. (C) MOLT-4 cells were incubated with either 10 μM wt Gal-1 or 10 μM C2S-Gal-1 with or without DTT at the concentrations indicated for 8 hours, followed by analysis for cellular shrinkage by flow cytometry. Error bars represent the standard deviation of duplicate samples.
Figure 10
Figure 10
DTT, but not reduced glutathione, primes MOLT-4 cells for Gal-1–induced apoptosis. (A) MOLT-4 cells were treated with 3 mM DTT or 3 mM reduced glutathione (RG) as indicated with or without 10 μM Gal-1 for 9 hours followed by detection for PS exposure (annexin-V+/PI) and membrane integrity loss (annexin-V+/PI+). Error bars represent the standard deviation of duplicate samples. MOLT-4 cells were treated with PBS (B), 3 mM DTT (C), 3 mM RG (D), 10 μM Gal-1 (E), 10 μM Gal-1 + 3 mM DTT (F), or 10 μM Gal-1 + 3 mM RG (G) for 9 hours followed by detection for changes in the light-scattering properties of the cell. Gate values of cells experiencing no changes in forward- and side-scatter profile are shown.

Similar articles

Cited by

References

    1. Jacobson MD, Weil M, Raff MC. Programmed cell death in animal development. Cell. 1997;88:347–354. - PubMed
    1. Nagata S. Apoptosis by death factor. Cell. 1997;88:355–365. - PubMed
    1. Stroh C, Schulze-Osthoff K. Death by a thousand cuts: an ever increasing list of caspase substrates. Cell Death Differ. 1998;5:997–1000. - PubMed
    1. Vaux DL, Korsmeyer SJ. Cell death in development. Cell. 1999;96:245–254. - PubMed
    1. Simon HU. Targeting apoptosis in the control of inflammation. Eur Respir J Suppl. 2003;44:20s–21s. - PubMed

Publication types

MeSH terms