. 2007 Jan 1;109(1):343-52.
doi: 10.1182/blood-2006-03-006569. Epub 2006 Aug 29.

Maturation and enucleation of primitive erythroblasts during mouse embryogenesis is accompanied by changes in cell-surface antigen expression

Affiliations

Maturation and enucleation of primitive erythroblasts during mouse embryogenesis is accompanied by changes in cell-surface antigen expression

Stuart T Fraser et al. Blood. .

Erratum in

  • Blood. 2007 Jun 1;109(11):4616

Abstract

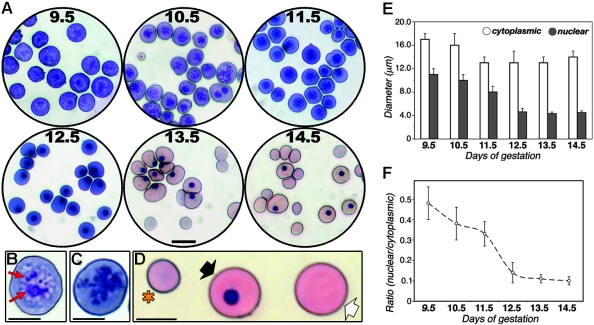
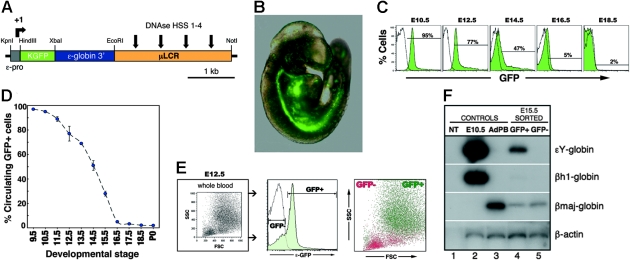
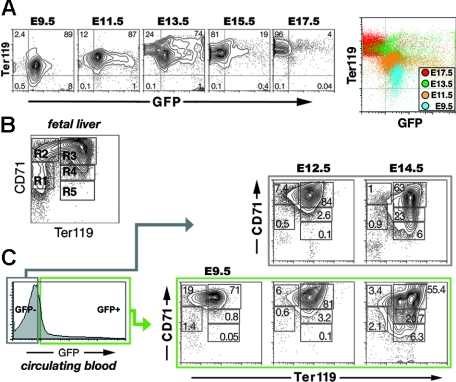
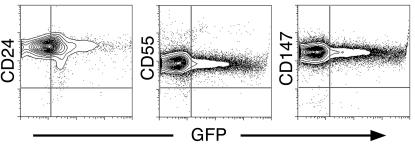
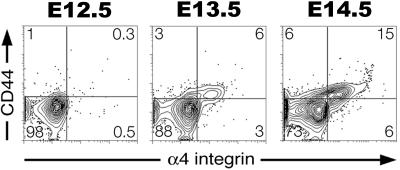
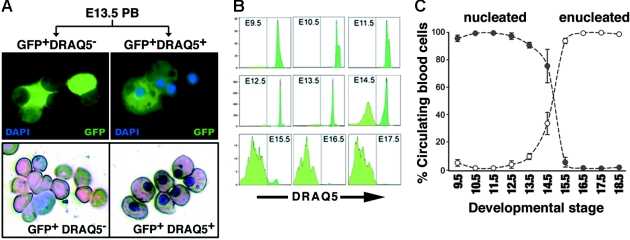
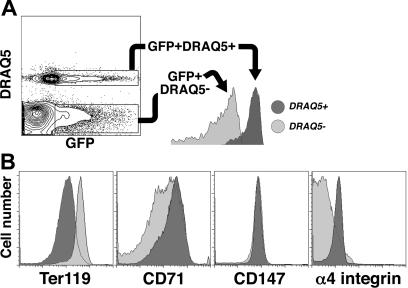
Primitive erythroblasts (EryPs) are the first hematopoietic cell type to form during mammalian embryogenesis and emerge within the blood islands of the yolk sac. Large, nucleated EryPs begin to circulate around midgestation, when connections between yolk sac and embryonic vasculature mature. Two to 3 days later, small cells of the definitive erythroid lineage (EryD) begin to differentiate within the fetal liver and rapidly outnumber EryPs in the circulation. The development and maturation of EryPs remain poorly defined. Our analysis of embryonic blood at different stages reveals a stepwise developmental progression within the EryP lineage from E9.5 to E12.5. Thereafter, EryDs are also present in the bloodstream, and the 2 lineages are not easily distinguished. We have generated a transgenic mouse line in which the human epsilon-globin gene promoter drives expression of green fluorescent protein exclusively within the EryP lineage. Here, we have used this line to characterize changes in cell morphology and surface-marker expression as EryPs mature and to track EryP numbers and enucleation throughout gestation. This study identifies previously unrecognized synchronous developmental stages leading to the maturation of EryPs in the mouse embryo. Unexpectedly, we find that EryPs are a stable cell population that persists through the end of gestation.


Conflict of interest statement

Conflict-of-interest disclosure: The authors declare no competing financial interests.

Figures

Figure 1
Figure 1
Cytologic changes during primitive erythroid maturation. (A) Giemsa-stained cytospin preparations of blood from wild-type embryos at E9.5 to E14.5. Scale bar, 20 μm. Circulating blood cells from E9.5 (B) and E10.5 (C) embryos, showing loss of nucleoli (red arrows in B) within the intervening 24-hour period. Scale bar, 10 μm. (D) Enucleated definitive (*), larger nucleated primitive (black arrow) and enucleated primitive (white arrow) erythroid cells in circulation at E14.5. Scale bar, 10 μm. (E) Diameters of circulating E9.5 to E14.5 embryonic blood cells (□) and their nuclei (▩), measured on cytospin preparations using the Axiovision program. (F) Ratio of mean cross-sectional area of nuclei and cytoplasms of circulating embryonic blood cells. A dramatic decrease in nuclear diameter and cross-sectional area was observed, coincident with nuclear condensation (compare with panel A). Data in panels E and F are expressed as mean ± SD.
Figure 2
Figure 2
Human ϵ-globin::KGFP transgenic mouse line as a model system for monitoring primitive erythroid development. (A) Cartoon of the ϵ-globin::KGFP transgenic construct. (B) Photograph of E9.5 ϵ-globin::KGFP embryo. GFP+ cells are seen throughout the circulation. (C) Flow cytometric analysis of circulating blood from E10.5 to E18.5. White area indicates cells from nontransgenic littermate. (D) Graphic representation of data from panel C and Table 2, highlighting the rapid decrease in the fraction of circulating blood cells that contains EryPs between E13.5 and E16.5. (E) Forward scatter (FSC) and side scatter (SSC) profiles of GFP+ and GFP populations. (F) RT-PCR analysis of ϵY-, βh1-, and βmaj-globin gene transcription in FACS-sorted GFP+ and GFP cells from E15.5 embryos. NT indicates no template (-DNA); E10.5, peripheral blood from E10.5 embryo; AdPB, adult peripheral blood.
Figure 3
Figure 3
Maturation of primitive erythroblasts is reflected in their expression of Ter119 and CD71. (A) Increase in Ter119 expression on the surface of live GFP+ cells from the circulation of E9.5 to E17.5 embryos. These changes are displayed in the color-coded composite density plot on the right. Axes indicate relative logarithmic fluorescence units for Ter119-PE (y-axis) and GFP (x-axis). (B) Density plot of a typical CD71 and Ter119 staining pattern on viable cells dispersed from wild-type whole E14.5 fetal liver. Axes indicate relative logarithmic fluorescence units for Ter119-APC (x-axis) and CD71-PE (y-axis). Regions R1 to R5 are defined by their characteristic CD71 and Ter119 staining pattern of their cells. The cells in each region can be classified by morphology as follows: primitive progenitor cells and proerythroblasts (R1), proerythroblasts and early basophilic erythroblasts (R2), early and late basophilic erythroblasts (R3), chromatophilic and orthochromatophilic erythroblasts (R4), and late orthochromatophilic erythroblasts and reticulocytes (R5). (C) Density plots of FACS-sorted GFP+ cells from E.9.5 and GFP cells from E9.5, E12.5, and E14.5 embryos. As observed for unfractionated fetal liver cells (B), the circulating cells could be divided into 5 populations (R1 to R5). The greatest numbers of immature cells (R1 and R2) were found at E9.5. By E14.5, significantly larger numbers of mature EryP/GFP+ and EryD/GFP cells (R4 and R5) were seen. Note that, although most EryPs were strongly GFP+, there was some heterogeneity in the level of expression of the transgene and this accounts for the appearance of a tail in the plot on the left.
Figure 4
Figure 4
Expression of definitive erythroid surface antigens on circulating primitive erythroid cells. Circulating E14.5 EryP/GFP+ cells showed strong surface expression of CD24, CD55, and CD147 by flow cytometry.
Figure 5
Figure 5
Developmental regulation of adhesion molecule expression on maturing primitive erythroid cells. EryP/GFP+ cells were gated and assessed for expression of CD44 and α4 integrin from E12.5 to E14.5. A subset of EryP/GFP+ cells up-regulated expression of both CD44 and α4 integrin adhesion molecules.
Figure 6
Figure 6
Monitoring enucleation of the primitive erythroid population using the cell-permeable DNA-binding dye DRAQ5. (A) Blood cells were harvested from the circulation of GFP+ E13.5 embryos, incubated with DRAQ5, and sorted according to expression of GFP and uptake of DRAQ5. DRAQ5 uptake was a clear indicator of the presence of a nucleus in each cell, as revealed by Giemsa staining (bottom). No fluorescent signal was detected in the GFP cell populations. (B) DRAQ5 profiles of GFP+ cells harvested from E9.5 (when all EryP/GFP+ cells were DRAQ5high) to E18.5 (when almost all EryP/GFP+ cells were DRAQ5neg). (C) Decline in numbers of nucleated EryP (●) versus the increase in numbers of enucleated EryP (○) in the circulation during embryogenesis, expressed as mean ± SEM. The total numbers of EryP remained stable throughout gestation.
Figure 7
Figure 7
Redistribution of surface antigens following enucleation of primitive erythroid cells. (A) Flow cytometric identification of nucleated and enucleated EryP based on DRAQ5 uptake. GFP+DRAQ5high (nucleated) cells, dark gray area; GFP+DRAQ5neg (enucleated) cells, light gray area. (B) GFP+ cells were gated according to DRAQ5 uptake (A) and assessed for surface antigen expression. Ter119 levels were higher on enucleated reticulocytes (dark gray area) than on nucleated primitive erythroblasts (light gray area). Expression of CD71 and α4 integrin were lower on enucleated than on nucleated EryP/GFP+ cells. No differences in expression of CD147 were seen.

References

    1. Palis J, Robertson S, Kennedy M, Wall C, Keller G. Development of erythroid and myeloid progenitors in the yolk sac and embryo proper of the mouse. Development. 1999;126:5073–5084. - PubMed
    1. Palis J, Yoder M. Yolk-sac hematopoiesis: the first blood cells of mouse and man. Exper Hematol. 2001;29:927–936. - PubMed
    1. Koury MJ, Sawyer ST, Brandt SJ. New insights into erythropoiesis. Curr Opin Hematol. 2002;9:93–100. - PubMed
    1. Miller JL. Hemoglobin switching and modulation: genes, cells, and signals. Curr Opin Hematol. 2002;9:87–92. - PubMed
    1. Kingsley PD, Malik J, Emerson RL, et al. “Maturational” globin switching in primary primitive erythroid cells. Blood. 2006;107:1665–1672. - PMC - PubMed

Publication types

MeSH terms