. 2006 Sep;80(18):9207-16.
doi: 10.1128/JVI.00929-06.

Transcriptional profiling reveals a possible role for the timing of the inflammatory response in determining susceptibility to a viral infection

Affiliations

Transcriptional profiling reveals a possible role for the timing of the inflammatory response in determining susceptibility to a viral infection

Thomas Ruby et al. J Virol. 2006 Sep.

Abstract

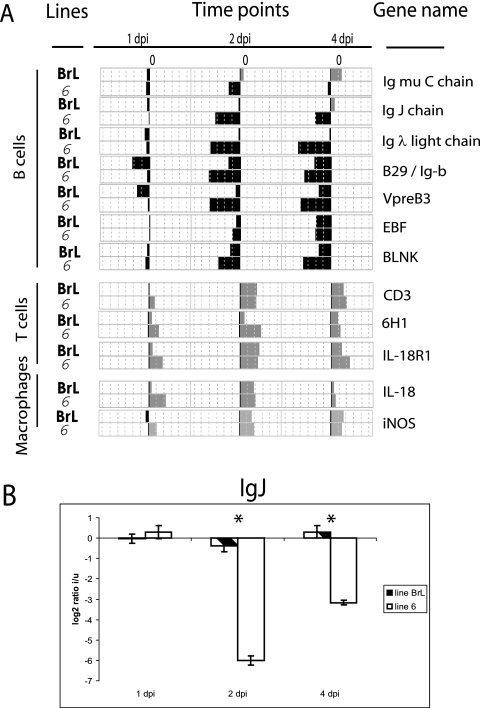
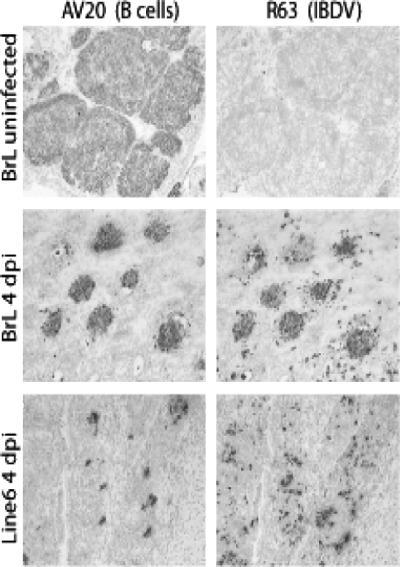
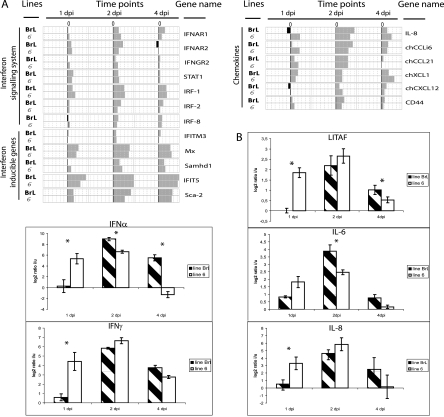
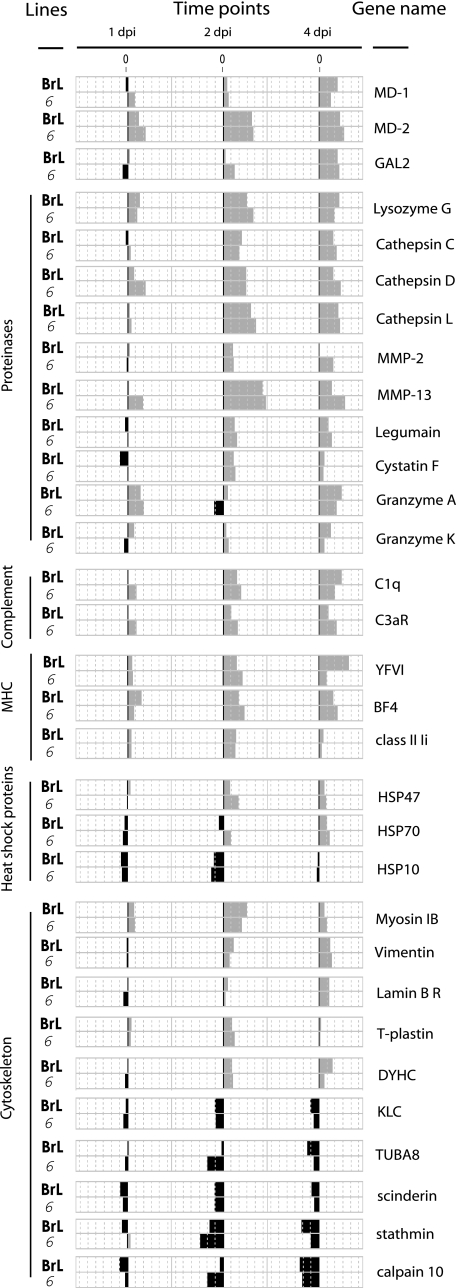
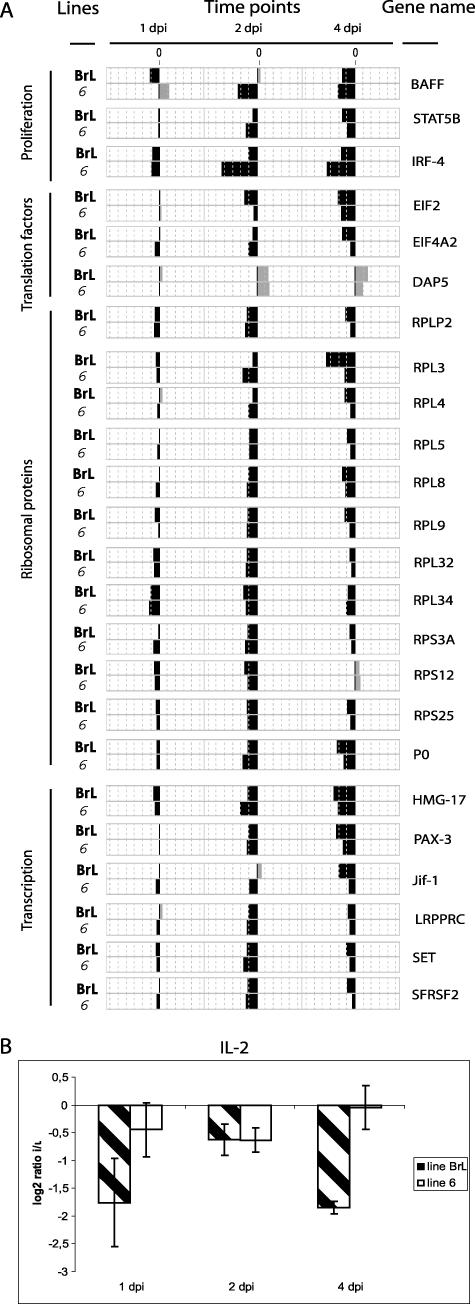
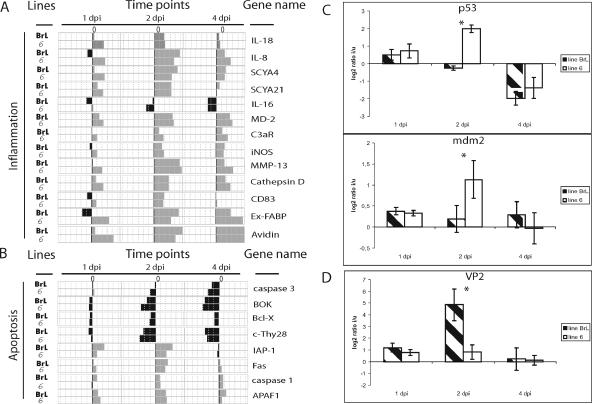
Using a novel cDNA microarray prepared from sources of actively responding immune system cells, we have investigated the changes in gene expression in the target tissue during the early stages of infection of neonatal chickens with infectious bursal disease virus. Infections of two lines of chickens previously documented as genetically resistant and sensitive to infection were compared in order to ascertain early differences in the response to infection that might provide clues to the mechanism of differential genetic resistance. In addition to major changes that could be explained by previously described changes in infected tissue, some differences in gene expression on infection, and differences between the two chicken lines, were observed that led to a model for resistance in which a more rapid inflammatory response and more-extensive p53-related induction of apoptosis in the target B cells might limit viral replication and consequent pathology. Ironically, the effect in the asymptomatic neonatal infection is that more-severe B-cell depletion is seen in the more genetically resistant chicken. Changes of expression of many chicken genes of unknown function, indicating possible roles in the response to infection, may aid in the functional annotation of these genes.


Figures

FIG. 1.
FIG. 1.
Changes in the cellular composition of the bursa after infection. (A) Comparison of changes in gene expression at 1, 2, and 4 days postinfection (dpi) with IBDV in the BrL and 6 lines. At each time point, the bars represent the ratios calculated between infected and uninfected birds. The length of each bar is proportional to the log2 value of the ratio. The positive and negative ratios correspond to a light-gray bar and a dark bar, respectively. The name of each gene is indicated. (B) Quantitative RT-PCR analysis of IgJ gene expression at 1, 2, and 4 days after infection (dpi). The log2 values of the ratios calculated between infected (i) and uninfected (u) birds are shown for each time point. BrL and 6 lines are represented by streaked and white bars, respectively. Significant differences in expression between chicken lines at a particular time point (P ≤ 0.05) are indicated by an asterisk. Errors bars indicate standard errors of the means.
FIG. 2.
FIG. 2.
Immunohistological analysis of bursa at 4 days after infection. Paired left and right panels show serial sections stained with either AV20 MAb to reveal surviving B cells or R63 MAb to reveal viral antigen. The upper four panels are sections from BrL birds, uninfected at the top and infected below. The bottom panels are sections from an infected White Leghorn line 6 bird.
FIG. 3.
FIG. 3.
Transcriptional patterns of cytokine genes. (A) Comparison of changes in gene expression at 1, 2, and 4 days postinfection (dpi) with IBDV in the BrL and 6 lines. (B) Quantitative RT-PCR analysis of the IFN-α, IFN-γ, IL-6, IL-8, and LITAF gene expression at 1, 2, and 4 days after infection (dpi). The log2 values of the ratios calculated between infected (i) and uninfected (u) birds are shown for each time point. BrL and 6 lines are represented by streaked and white bars, respectively. Significant differences in expression between chicken lines at a particular time point (P ≤ 0.05) are indicated by an asterisk. Errors bars indicate standard errors of the means.
FIG. 4.
FIG. 4.
Transcriptional profiles of immune response genes. Comparison of changes in gene expression at 1, 2, and 4 days postinfection (dpi) with IBDV in the BrL and 6 lines.
FIG. 5.
FIG. 5.
Transcriptional profiles of down-regulated immune response genes. (A) Comparison of changes in gene expression at 1, 2, and 4 days postinfection (dpi) with IBDV in the BrL and 6 lines. (B) Quantitative RT-PCR analysis of the IL-2 gene expression at 1, 2, and 4 days after infection (dpi). The log2 values of the ratios calculated between infected (i) and uninfected (u) birds are shown for each time point. BrL and 6 lines are represented by streaked and white bars, respectively. Errors bars indicate standard errors of the means.
FIG. 6.
FIG. 6.
Analysis of the difference of gene expression during response to infection by IBDV in inbred resistant and susceptible lines. (A) Transcriptional profiles of inflammatory response genes and comparison of changes in gene expression at 1, 2, and 4 days postinfection (dpi) with IBDV in the BrL and 6 lines. (B) Transcriptional profiles of apoptosis-related genes. (C) Quantitative RT-PCR analysis of p53 and mdm2 gene expression at 1, 2, and 4 days after infection (dpi). The log2 values of the ratios calculated between infected (i) and uninfected (u) birds are shown for each time point. BrL and 6 lines are represented by streaked and white bars, respectively. (D) Virus load all along the infection in lines 6 and BrL. Quantitative RT-PCR analysis of VP2 gene expression at 1 and 2 days after infection (dpi). Significant differences in expression between chicken lines at a particular time point (P ≤ 0.05) are indicated by an asterisk. Errors bars indicate standard errors of the means.

Similar articles

Cited by

References

    1. Abdrakhmanov, I., D. Lodygin, P. Geroth, H. Arakawa, A. Law, J. Plachy, B. Korn, and J. M. Buerstedde. 2000. A large database of chicken bursal ESTs as a resource for the analysis of vertebrate gene function. Genome Res. 10:2062-2069. - PMC - PubMed
    1. Barak, Y., T. Juven, R. Haffner, and M. Oren. 1993. mdm2 expression is induced by wild type p53 activity. EMBO J. 12:461-468. - PMC - PubMed
    1. Beug, H., A. von Kirchbach, G. Doderlein, J. F. Conscience, and T. Graf. 1979. Chicken hematopoietic cells transformed by seven strains of defective avian leukemia viruses display three distinct phenotypes of differentiation. Cell 18:375-390. - PubMed
    1. Boardman, P. E., J. Sanz-Ezquerro, I. M. Overton, D. W. Burt, E. Bosch, W. T. Fong, C. Tickle, W. R. Brown, S. A. Wilson, and S. J. Hubbard. 2002. A comprehensive collection of chicken cDNAs. Curr. Biol. 12:1965-1969. - PubMed
    1. Bumstead, N., and B. J. Millard. 1992. Variation in susceptibility of inbred lines of chickens to seven species of Eimeria. Parasitology 104:407-413. - PubMed

Publication types

Substances