. 2006 Aug 28;174(5):725-34.
doi: 10.1083/jcb.200603034.

Integrin-mediated adhesion regulates membrane order

Affiliations

Integrin-mediated adhesion regulates membrane order

Katharina Gaus et al. J Cell Biol. .

Abstract

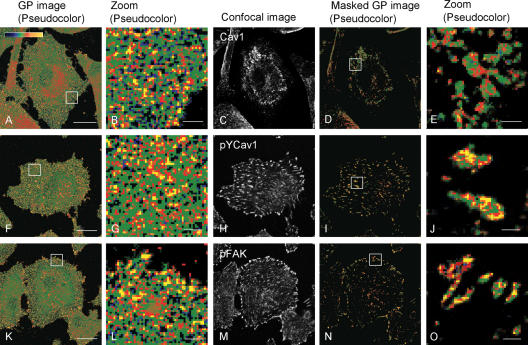
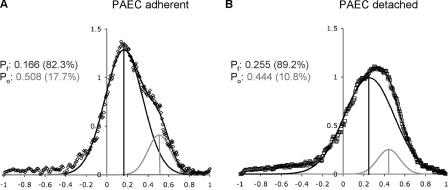
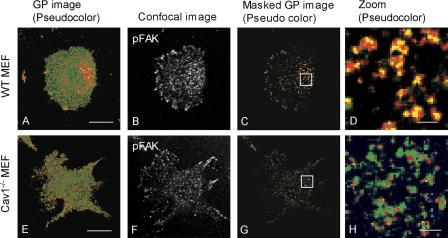
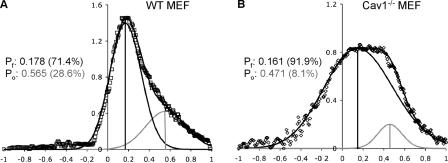
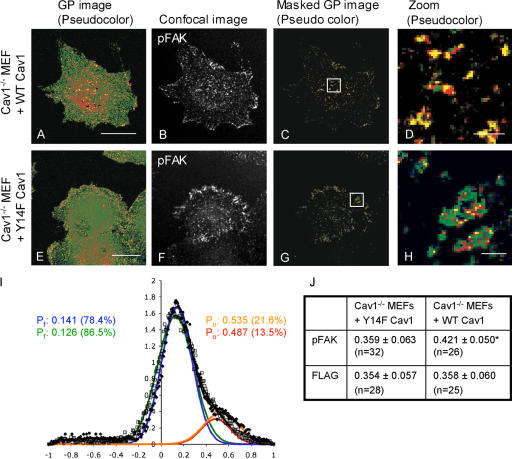
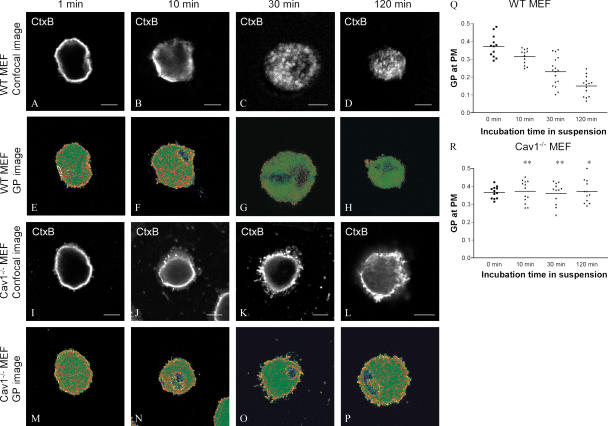
The properties of cholesterol-dependent domains (lipid rafts) in cell membranes have been controversial. Because integrin-mediated cell adhesion and caveolin both regulate trafficking of raft components, we investigated the effects of adhesion and caveolin on membrane order. The fluorescent probe Laurdan and two-photon microscopy revealed that focal adhesions are highly ordered; in fact, they are more ordered than caveolae or domains that stain with cholera toxin subunit B (CtxB). Membrane order at focal adhesion depends partly on phosphorylation of caveolin1 at Tyr14, which localizes to focal adhesions. Detachment of cells from the substratum triggers a rapid, caveolin-independent decrease in membrane order, followed by a slower, caveolin-dependent decrease that correlates with internalization of CtxB-stained domains. Endocytosed CtxB domains also become more fluid. Thus, membrane order is highly dependent on caveolae and focal adhesions. These results show that lipid raft properties are conferred by assembly of specific protein complexes. The ordered state within focal adhesions may have important consequences for signaling at these sites.


Figures

Figure 1.
Figure 1.
GP and immunofluorescence images of PAEC. PAEC on FN-coated glass coverslips for 2–4 h were Laurdan labeled, fixed, and immunostained as described in Materials and methods. GP images (A, F, and K) were calculated from intensity images (see Materials and methods) and pseudocolored with blue to yellow representing low to high GP values, respectively (see color scale in A). B, G, and L show magnified regions of the GP images. Image in C is stained for Cav1, in H is stained for pYCav1, and in M for pFAK. In D, I, and N, GP values are shown only for the pixels where immunostains are above background. E, J, and O show magnified regions of the masked GP images. Bars: (A, F, and K) 20 μm; (B, G, L, E, J, and O) 2 μm.
Figure 2.
Figure 2.
Global GP distributions of adherent and detached PAEC. PAEC were plated on FN-coated coverslips for 2–4 h (A, open diamonds) or suspended for ∼1–2 min (B, open squares). GP images (n > 12), from a single experiment to minimize differences in Laurdan distribution between intracellular membranes, were recorded close to the coverslip, normalized, and fitted to two Gaussian populations (line through data). Black vertical lines denote the centers of the fluid population (Pf); gray vertical lines denote the centers of the ordered populations (Po). Center values and coverages are given for both populations. ERFs, which quantifies the quality of the fit to the data (see Materials and methods), are 0.0071 and 0.0062 for A and B, respectively.
Figure 3.
Figure 3.
GP and immunofluorescent images of WT and Cav1−/− MEFs. WT (A–D) and Cav1−/− (E–H) MEFs on FN-coated glass coverslips for 2–4 h were Laurdan labeled, immunostained, and imaged as described in Materials and methods. GP image pseudocoloring (A and E) and masking with confocal images were performed as for Fig. 1. B and F show the corresponding confocal images of pFAK, C and G show GP values of pFAK-stained pixels, and D and H show magnified sections of the masked GP images. Bars: (A and E) 20 μm; (D and H) 2 μm.
Figure 4.
Figure 4.
Global GP distribution of adherent WT and Cav1−/− MEFs. Normalized histograms for GP from Cav1−/− and WT MEFs on FN-coated coverslips (n >12 images from a single experiment) were fitted to two Gaussian populations (line through data). (A) WT MEFs (open diamonds). (B) Cav1−/− MEFs (open squares). Black vertical lines denote centers of the fluid, gray vertical lines of the ordered populations. Centers and coverages of fluid (Pf) and ordered (Po) are given. ERF for A and B are 0.0086 and 0.0042, respectively.
Figure 5.
Figure 5.
GP and immunofluorescent images of transfected Cav1−/− MEFs. Cav1−/− MEFs transfected with WT Cav1 (A–D) or Y14F Cav1 (E–H) on FN-coated glass coverslips for 3 h were labeled, fixed, and immunostained as described in Materials and methods. GP images were pseudocolored (A and E) and masked as for Fig. 1. B and F show the corresponding confocal images of pFAK, C and G show the GP values of pFAK-stained regions, and D and H show magnified regions of the masked images. (I) GP distribution (closed diamonds, WT Cav1; open squares, Y14F Cav1) of transfected Cav1−/− MEFs (n = 20) fitted to two Gaussian populations (solid black lines). The vertical lines denote the center for fluid populations (Pf: WT Cav1, blue; Y14F Cav1, green) and ordered populations (Po: WT Cav1, orange; Y14F Cav1, red). Centers and coverages are given for both populations. ERFs for WT- and Y14F-transfected cells were 0.0051 and 0.0036, respectively. (J) Table listing the mean ± the SD of GP values of pixels stained for pFAK or FLAG. A statistically significant difference within pFAK domains between cells transfected with WT Cav1 and Y14F Cav1 of P < 0.001 is indicated with an asterisk.
Figure 6.
Figure 6.
GP in CtxB-stained regions in suspended WT and Cav1−/− MEFs. WT MEFs (A–H and Q) and Cav1−/− MEFs (I–P and R) were labeled with CTxB, detached, and held in suspension for the indicated times, and processed as described in Materials and methods. A–D and I–L show confocal cross sections of the CTxB staining. E–H and M–P are pseudocolored GP images. (Q and R) GP values of the plasma membrane defined as the outer 0.5–1.2 μm of GP images (E). GP values were determined at four sites for each image, and each symbol represents the mean GP value of one image; means of means are indicated by horizontal bars. One and two asterisks in R indicate a statistical difference between WT and Cav1−/− MEFs of P < 0.05 and P < 0.001, respectively.

References

    1. Bagatolli, L.A., S.A. Sanchez, T. Hazlett, and E. Gratton. 2003. Giant vesicles, Laurdan, and two-photon fluorescence microscopy: evidence of lipid lateral separation in bilayers. Methods Enzymol. 360:481–500. - PubMed
    1. Brown, D.A., and E. London. 1998. Structure and origin of ordered lipid domains in biological membranes. J. Membr. Biol. 164:103–114. - PubMed
    1. Chapman, H.A., Y. Wei, D.I. Simon, and D.A. Waltz. 1999. Role of urokinase receptor and caveolin in regulation of integrin signaling. Thromb. Haemost. 82:291–297. - PubMed
    1. Decker, L., and C. Ffrench-Constant. 2004. Lipid rafts and integrin activation regulate oligodendrocyte survival. J. Neurosci. 24:3816–3825. - PMC - PubMed
    1. del Pozo, M.A., W.B. Kiosses, N.B. Alderson, N. Meller, K.M. Hahn, and M.A. Schwartz. 2002. Integrins regulate GTP-Rac localized effector interactions through dissociation of Rho-GDI. Nat. Cell Biol. 4:232–239. - PubMed

Publication types

MeSH terms