. 2006 Nov;17(11):4736-47.
doi: 10.1091/mbc.e06-04-0368. Epub 2006 Aug 30.

A survey of essential gene function in the yeast cell division cycle

Affiliations

A survey of essential gene function in the yeast cell division cycle

Lisa Yu et al. Mol Biol Cell. 2006 Nov.

Abstract

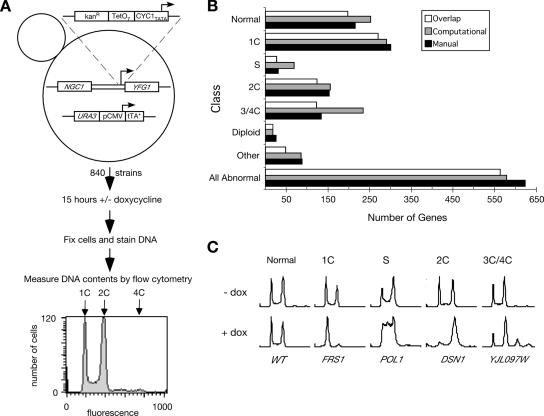
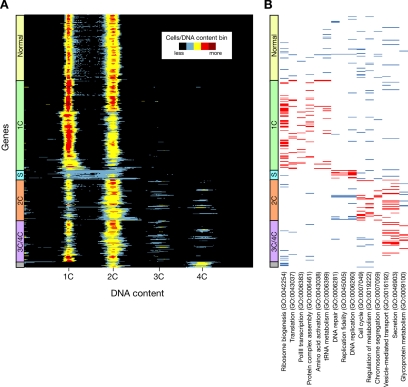
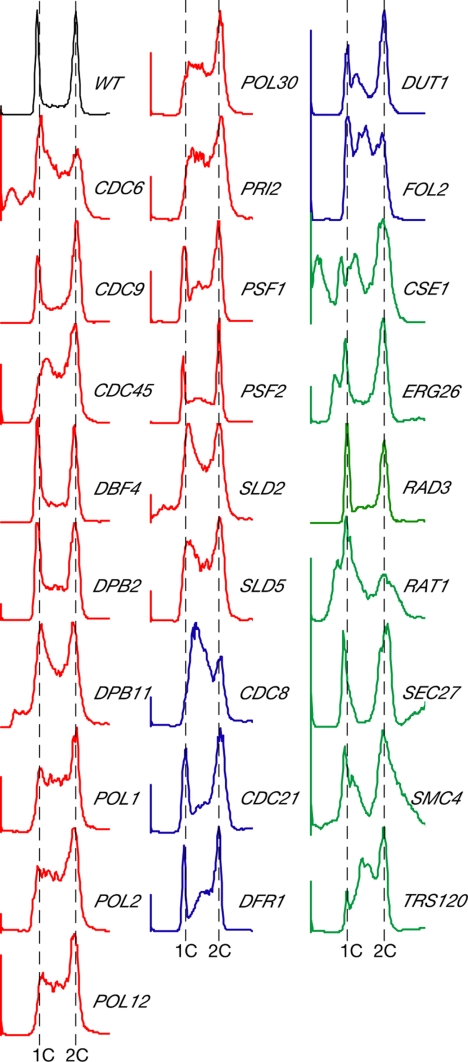
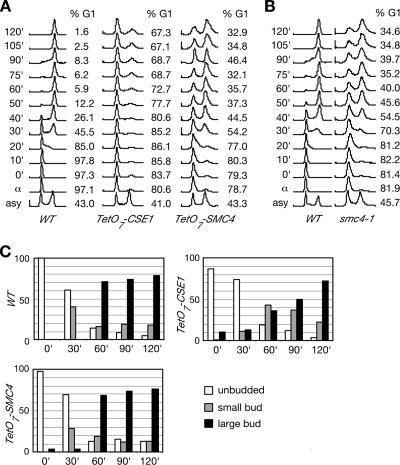
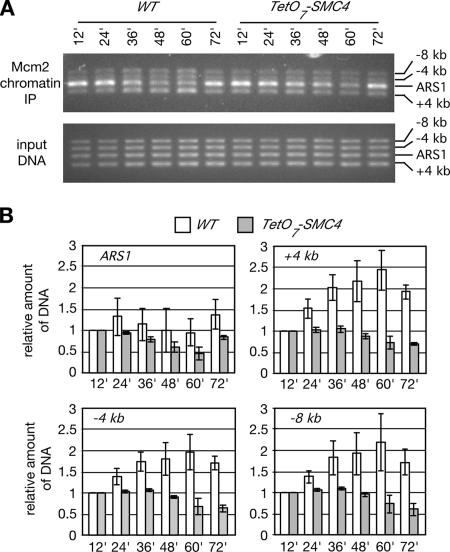
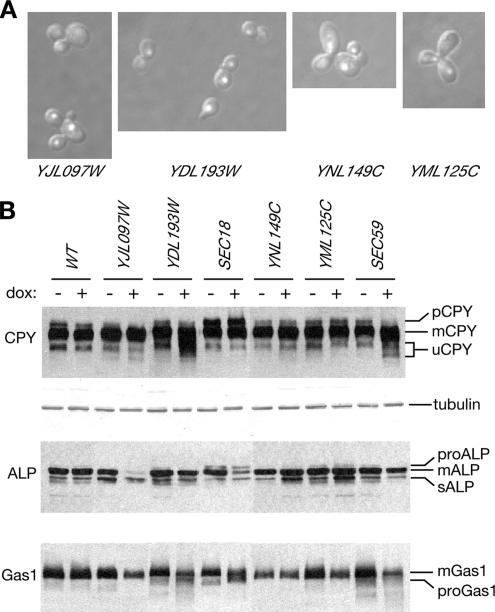
Mutations impacting specific stages of cell growth and division have provided a foundation for dissecting mechanisms that underlie cell cycle progression. We have undertaken an objective examination of the yeast cell cycle through flow cytometric analysis of DNA content in TetO(7) promoter mutant strains representing 75% of all essential yeast genes. More than 65% of the strains displayed specific alterations in DNA content, suggesting that reduced function of an essential gene in most cases impairs progression through a specific stage of the cell cycle. Because of the large number of essential genes required for protein biosynthesis, G1 accumulation was the most common phenotype observed in our analysis. In contrast, relatively few mutants displayed S-phase delay, and most of these were defective in genes required for DNA replication or nucleotide metabolism. G2 accumulation appeared to arise from a variety of defects. In addition to providing a global view of the diversity of essential cellular processes that influence cell cycle progression, these data also provided predictions regarding the functions of individual genes: we identified four new genes involved in protein trafficking (NUS1, PHS1, PGA2, PGA3), and we found that CSE1 and SMC4 are important for DNA replication.


Figures

Figure 1.
Figure 1.
A cell cycle screen of the essential genes in yeast. (A) Schematic diagram of the cell cycle screen. Strains were constructed by replacement of native promoters with a TetO7 cassette in the strain R1158, which contains sequences encoding the tet “off” activator tTA* integrated at URA3. YFG1, your favorite gene; NGC1, next gene on chromosome. The flow cytometry data are displayed as a histogram with fluorescence intensity (which is proportional to DNA content) plotted on the x-axis, and the number of cells with a given intensity plotted on the y-axis. The positions of cells with 1C, 2C, and 4C DNA contents are indicated. (B) Manual and computational scoring of the flow cytometry histograms. The number of TetO7 strains displaying each category of cell cycle profile is indicated for manual scoring and computational scoring. Strains that were placed in the same category by both methods are indicated as the overlap. (C) Flow cytometry histograms of mutants showing strong cell cycle effects in each category are shown, with the relevant gene indicated. The number of cells is indicated on the y-axis, and the DNA content is indicated on the x-axis.
Figure 2.
Figure 2.
Enrichment of specific gene functions within the different flow cytometry categories. (A) Cluster diagram of flow cytometry histograms. Genes are positioned along the y-axis and DNA content is indicated on the x-axis. Genes are grouped into different categories according to the overlap between the computational and manual analysis and are clustered within the categories according to the similarity of the flow cytometry profiles. The number of cells with a given DNA content is indicated by color, with black representing the minimum and brown representing the maximum. The categories of flow cytometry profiles are indicated, with the category in gray being the diploid category. (B) GO-gram indicating statistically significant enrichments of gene ontology (GO) annotations from the biological process hierarchy of TetO7 alleles in each flow cytometry category. Red bars indicate that a particular gene is annotated with the given GO category and that the GO category is significantly overrepresented within the cell cycle category in which the gene was placed. Blue bars indicate that a particular gene is annotated with the given GO category and that the GO category is not significantly enriched within the given cell cycle category. Not all GO categories that displayed significant enrichment are shown.
Figure 3.
Figure 3.
Comparison of cell cycle phenotypes and cell sizes. (A) Cluster diagram of DNA content flow cytometry histograms and cell size profiles. Genes are grouped on the y-axis as in Figure 2A. Cell size data from (Mnaimneh et al., 2004) is presented alongside the flow cytometry data, with increasing cell sizes plotted on the x-axis, from left to right. The number of cells with a given cell size is indicated by color, with white representing the minimum and red representing the maximum. (B) Box plot of cell sizes in each cell cycle category. The horizontal black lines in the boxes indicate the median size bin where the cumulative sum of cells having a size corresponding to that bin, or a smaller size, reaches 50% of the total number of cells measured; the bottom and top of the boxes indicate the 25th and 75th percentiles, respectively. The vertical lines show the value range: the upper cap is drawn at the bin representing the largest size, and the lower cap is drawn at the bin representing the smallest size. The width of the boxes varies according to the number of genes per category.
Figure 4.
Figure 4.
Degree of G1 accumulation reflects gene function and growth defect. Genes in the 1C category are ordered from top to bottom by decreasing C1/C2 peak height ratio as shown. Quartiles are indicated at left. White dotted line indicates average wild-type C1/C2 ratio. The GO-gram indicates statistically significant enrichments of GO categories within the 1C flow cytometry category (p < 0.001). Red bars indicate that a particular gene is annotated with the given GO category and that the GO category is significantly over-represented within the cell cycle category in which the gene was placed. Blue bars indicate that a particular gene is annotated with the given GO category and that the GO category is not significantly enriched within the given cell cycle category. The growth scoring scheme is identical to that in (Mnaimneh et al., 2004).
Figure 5.
Figure 5.
Flow cytometry histograms for the S phase category. The flow cytometry histograms for wild type and each of the 27 genes scored as having S phase accumulation are shown. Cultures were sampled for flow cytometry 15 h after the addition of doxycycline. Genes with known functions in DNA replication (red) and nucleotide metabolism (blue) are indicated, as are genes with no previously described connection to S phase (green). The positions of 1C and 2C DNA contents are also indicated.
Figure 6.
Figure 6.
Depletion of CSE1 or SMC4 caused defects in S phase progression. (A) Flow cytometry histograms measuring DNA contents of WT, TetO7-CSE1, and TetO7-SMC4 cells in asynchronous culture (asy), arrested in G1 (α) and at the indicated times after release from G1 in the presence of doxycycline. Nocodazole was added at 60 min to prevent return to G1. The percent of cells in G1 at each time is indicated. (B) Flow cytometry histograms measuring DNA contents of WT and smc4-1 cells in asynchronous culture (asy), arrested in G1 (α) and at the indicated times after release from G1 at 30°C. The percent of cells in G1 at each time is indicated. (C) The percent of cells with no bud (□), small bud (▩), and large bud (■) was measured at the indicated times after release from G1.
Figure 7.
Figure 7.
Depletion of SMC4 caused replication fork defects. (A) Chromatin immunoprecipitation analysis of Mcm2 binding to ARS1 and adjacent regions in WT and TetO7-SMC4 cells. Cells were arrested in G1 and released into S phase in the presence of doxycycline. Sample were taken for ChIP analysis at the indicated times. DNA was amplified by PCR before (input) or after (IP) immunoprecipitation of Mcm2. Ethidium bromide–stained agarose gels of the products of multiplex PCR reactions to amplify ARS1, regions 4 kb upstream (+4 kb), 4 kb downstream (−4 kb), and 8 kb downstream (−8 kb) of ARS1 are shown. (B) The PCR products from three independent ChIP experiments were quantified and the average amount of DNA in each band relative to the amount in the 12-min sample is plotted. Error bars span one SD. The quantification of the PCR products for each region amplified (ARS1, +4 kb, −4 kb, and −8 kb) is plotted for WT (□) and for TetO7-SMC4 (▩).
Figure 8.
Figure 8.
Protein trafficking defects in the 3C/4C category. (A) Micrographs of four strains from the 3C and 4C accumulation category. Promoters were shut off by the addition of doxycycline, and cells were fixed after 10 h. Cells were stained with DAPI, which stains the nuclei, and cells were visualized by fluorescence and phase-contrast microscopy. Merged images are shown. (B) Immunoblots of carboxypeptidase Y (CPY), alkaline phosphatase (ALP), and Gas1 in the indicated TetO7 strains before and after the addition of doxycycline for 15 h. The positions of processing and trafficking intermediates of each protein are indicated (pCPY, ER/Golgi modified proCPY; uCPY, underglycosylated CPY; mCPY, mature CPY; proALP, ER/Golgi modified proALP; sALP, soluble ALP; mALP, mature ALP; proGas1, ER glycosylated proGas1; mGas1, mature Gas1). Tubulin is shown as a loading control.

Similar articles

Cited by

References

    1. Altmann K., Westermann B. Role of essential genes in mitochondrial morphogenesis in Saccharomyces cerevisiae. Mol. Biol. Cell. 2005;16:5410–5417. - PMC - PubMed
    1. Angermayr M., Roidl A., Bandlow W. Yeast Rio1p is the founding member of a novel subfamily of protein serine kinases involved in the control of cell cycle progression. Mol. Microbiol. 2002;44:309–324. - PubMed
    1. Aono N., Sutani T., Tomonaga T., Mochida S., Yanagida M. Cnd2 has dual roles in mitotic condensation and interphase. Nature. 2002;417:197–202. - PubMed
    1. Aparicio O. M. Tackling an essential problem in functional proteomics of Saccharomyces cerevisiae. Genome Biol. 2003;4:230. - PMC - PubMed
    1. Aparicio O. M., Weinstein D. M., Bell S. P. Components and dynamics of DNA replication complexes in S. cerevisiae: redistribution of MCM proteins and Cdc45p during S phase. Cell. 1997;91:59–69. - PubMed

Publication types

Substances