Immunostimulatory effects of the anionic alkali mineral complex Barodon on equine lymphocytes
- PMID: 16943344
- PMCID: PMC1656555
- DOI: 10.1128/CVI.00150-06
Immunostimulatory effects of the anionic alkali mineral complex Barodon on equine lymphocytes
Abstract
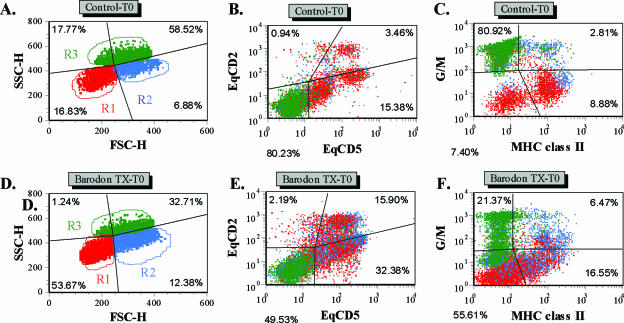
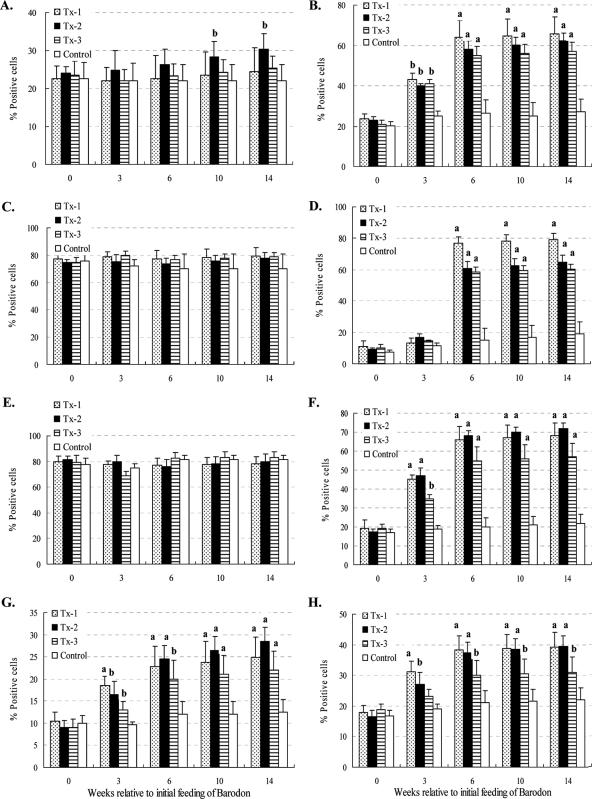
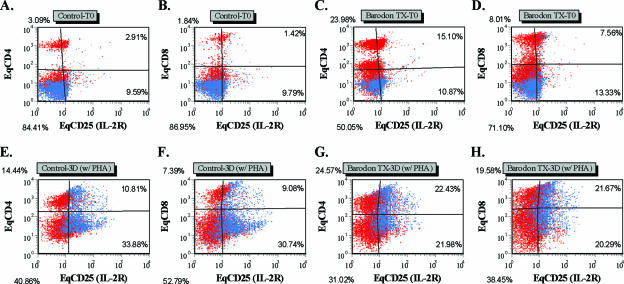
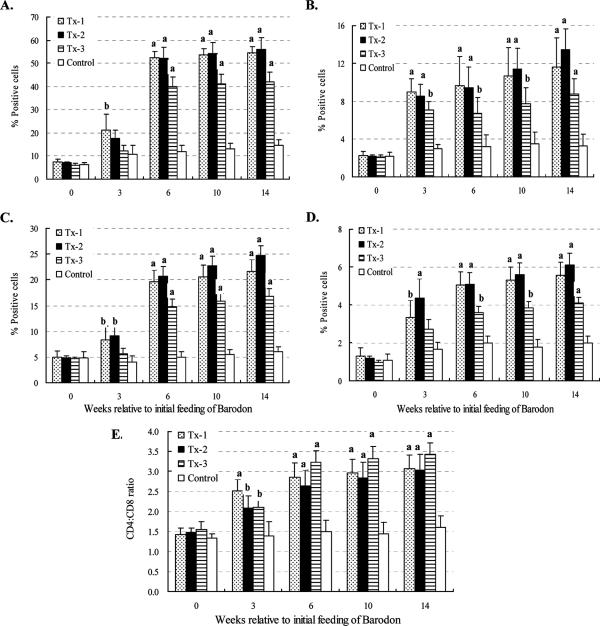
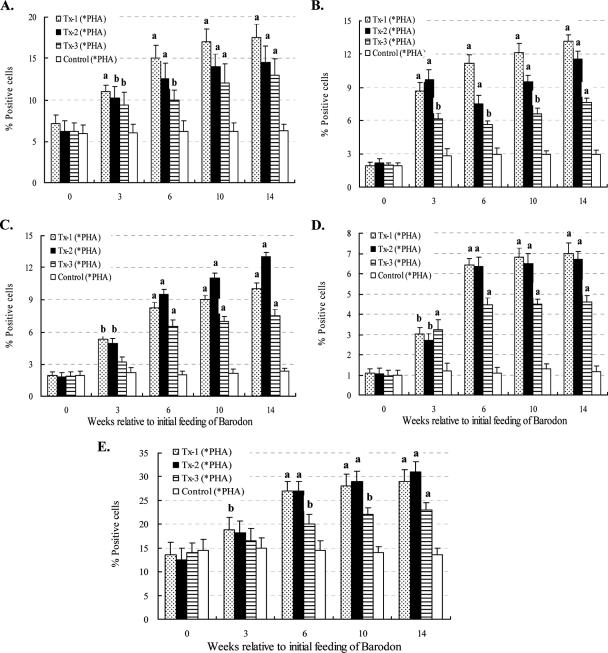
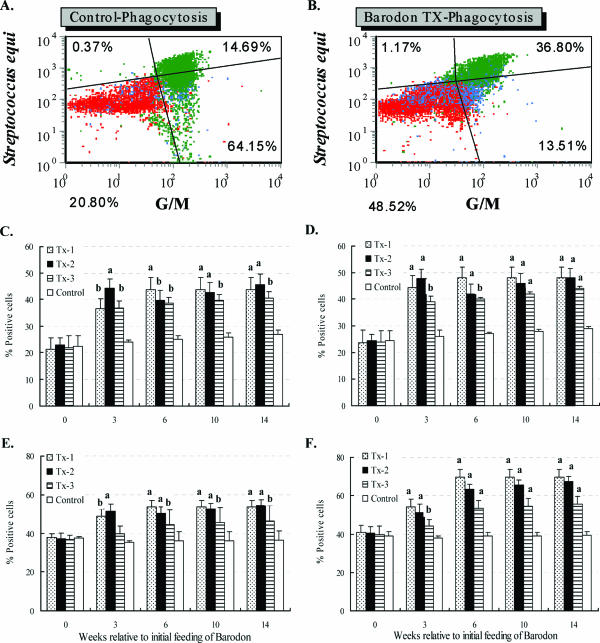
Previous studies have shown that the anionic alkali mineral complex BARODON has an immunoenhancing effect on pigs as an adjuvant and as a nonspecific immunostimulant. Likewise, the equine immune system has been defined with various monoclonal antibodies specific to equine leukocyte differentiation antigens to determine the possibility of enhancing equine resistance to respiratory diseases and promoting other immunostimulatory effects with the application of BARODON. Compared with the control group, after 3 weeks of treatment, BARODON-treated groups showed higher proportions of cells (P < 0.05) expressing major histocompatibility complex class II and CD2, CD4(+), CD4(+) CD25(+), CD8(+), and CD8(+) CD25(+) T lymphocytes, dendritic cells, and surface immunoglobulin M(+) B lymphocytes in peripheral blood, as well as enhanced cell proliferative responses with phytohemagglutinin and increased phagocytic activity against Streptococcus equi and Staphylococcus aureus strains with high antibiotic resistance, the bacteria frequently identified as etiologic agents of equine respiratory diseases at the Seoul Race Park in Seoul, Korea. This study shows that BARODON may act as an immunostimulator and can be an effective alternative to antimicrobial feed additives for nonspecific improvements in equine immune responses, particularly against respiratory diseases.
Figures
Similar articles
-
Immunostimulatory effects of anionic alkali mineral complex solution Barodon in porcine lymphocytes.J Vet Sci. 2001 Apr;2(1):15-24. J Vet Sci. 2001. PMID: 14614289
-
Relation between lymphocyte subpopulations of peripheral blood and immune responses of modified live hog cholera virus vaccine in pigs treated with an ionized alkali mineral complex.J Vet Sci. 2000 Jun;1(1):49-52. J Vet Sci. 2000. PMID: 14612620
-
Generation of in vitro natural cytotoxicity of horse lymphocytes against sarcoid-derived tumor cells not expressing major histocompatibility complex antigens.Am J Vet Res. 1996 Jul;57(7):992-9. Am J Vet Res. 1996. PMID: 8807009
-
Multiple effects of immunostimulatory DNA on T cells and the role of type I interferons.Springer Semin Immunopathol. 2000;22(1-2):77-84. doi: 10.1007/s002810000028. Springer Semin Immunopathol. 2000. PMID: 10944802 Review.
-
Characterization of porcine T lymphocytes and their immune response against viral antigens.J Biotechnol. 1999 Aug 20;73(2-3):223-33. doi: 10.1016/s0168-1656(99)00140-6. J Biotechnol. 1999. PMID: 10486931 Review.
Cited by
-
Biological and therapeutic effects of ortho-silicic acid and some ortho-silicic acid-releasing compounds: New perspectives for therapy.Nutr Metab (Lond). 2013 Jan 8;10(1):2. doi: 10.1186/1743-7075-10-2. Nutr Metab (Lond). 2013. PMID: 23298332 Free PMC article.
-
Role of the GLP2-Wnt1 axis in silicon-rich alkaline mineral water maintaining intestinal epithelium regeneration in piglets under early-life stress.Cell Mol Life Sci. 2024 Mar 12;81(1):126. doi: 10.1007/s00018-024-05162-x. Cell Mol Life Sci. 2024. PMID: 38470510 Free PMC article.
-
Effects of Dietary Supplementation of Barodon, an Anionic Alkali Mineral Complex, on Growth Performance, Feed Utilization, Innate Immunity, Goblet Cell and Digestibility in Olive Flounder (Paralichthys olivaceus).Asian-Australas J Anim Sci. 2014 Mar;27(3):383-90. doi: 10.5713/ajas.2013.13485. Asian-Australas J Anim Sci. 2014. PMID: 25049965 Free PMC article.
-
2D Nanoclay for Biomedical Applications: Regenerative Medicine, Therapeutic Delivery, and Additive Manufacturing.Adv Mater. 2019 Jun;31(23):e1900332. doi: 10.1002/adma.201900332. Epub 2019 Apr 3. Adv Mater. 2019. PMID: 30941811 Free PMC article. Review.
-
Effects of alkaline mineral complex water supplementation on growth performance, inflammatory response, and intestinal barrier function in weaned piglets.J Anim Sci. 2022 Oct 1;100(10):skac251. doi: 10.1093/jas/skac251. J Anim Sci. 2022. PMID: 35913841 Free PMC article.
References
-
- Ababou, A., W. C. Davis, and D. Levy. 1993. The DA6-147 monoclonal antibody raised against HLA-DR alpha chain identifies a cryptic epitope on the BoLA-DR alpha chain. Ann. Rech. Vet. 24:402-407. - PubMed
-
- Ababou, A., J. Goyeneche, W. C. Davis, and D. Levy. 1994. Evidence for the expression of three different BoLA-class II molecules on the bovine BL-3 cell line: determination of a non-DR non-DQ gene product. J. Leukoc. Biol. 56:182-186. - PubMed
-
- Antonini, J. M., J. R. Roberts, H. M. Yang, M. W. Barger, D. Ramsey, V. Castranova, and J. Y. Ma. 2000. Effect of silica inhalation on the pulmonary clearance of a bacterial pathogen in Fischer 344 rats. Lung 178:341-350. - PubMed
-
- Antonini, J. M., H. M. Yang, J. Y. Ma, J. R. Roberts, M. W. Barger, L. Butterworth, T. G. Charron, and V. Castranova. 2000. Subchronic silica exposure enhances respiratory defense mechanisms and the pulmonary clearance of Listeria monocytogenes in rats. Inhal. Toxicol. 12:1017-1036. - PubMed
-
- Biddison, W. E., and S. Shaw. 1989. CD4 expression and function in HLA class II-specific T cells. Immunol. Rev. 109:5-15. - PubMed
Publication types
MeSH terms
Substances
LinkOut - more resources
Full Text Sources
Medical
Molecular Biology Databases
Research Materials