. 2006 Sep;26(18):6832-43.
doi: 10.1128/MCB.01770-05.

Antagonistic regulation of beta-globin gene expression by helix-loop-helix proteins USF and TFII-I

Affiliations

Antagonistic regulation of beta-globin gene expression by helix-loop-helix proteins USF and TFII-I

Valerie J Crusselle-Davis et al. Mol Cell Biol. 2006 Sep.

Abstract

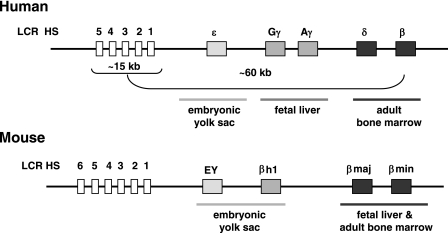
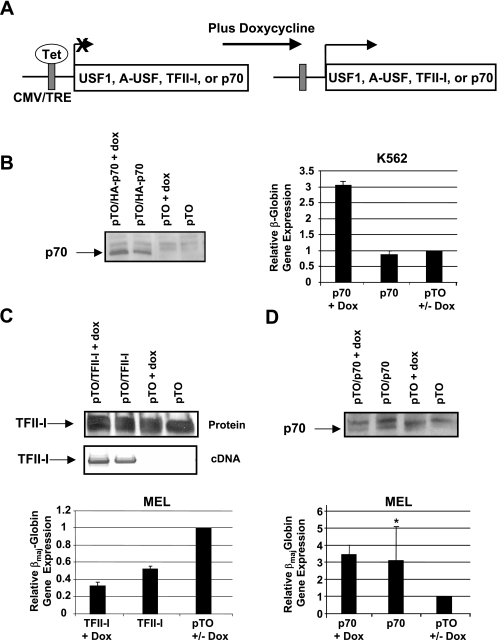
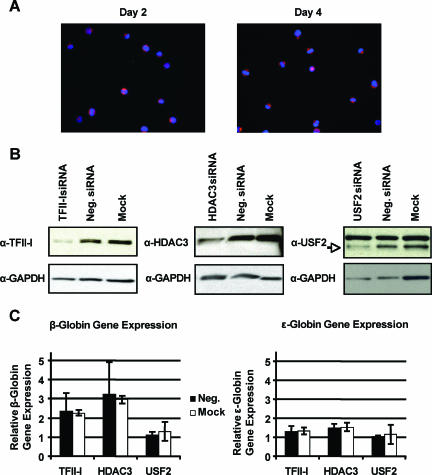
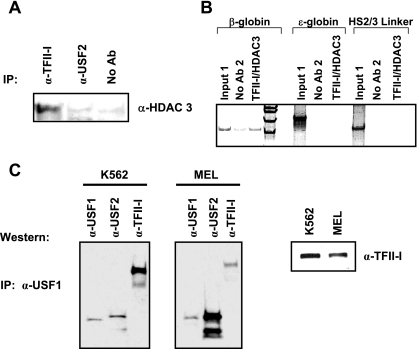
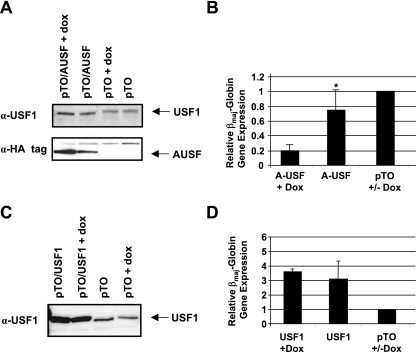
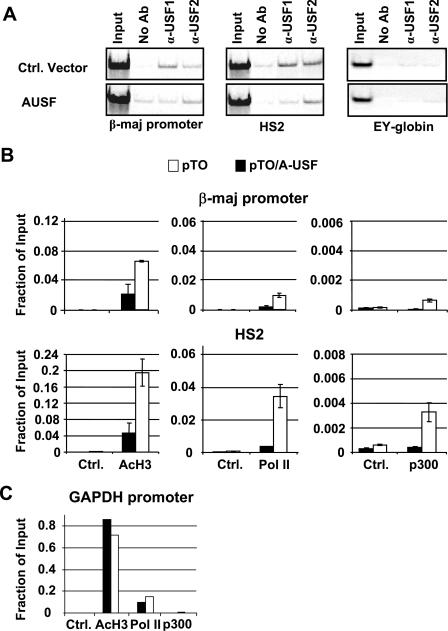
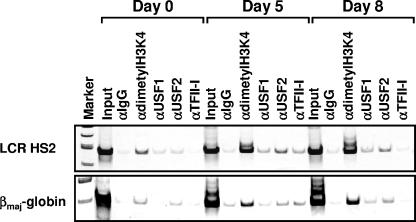
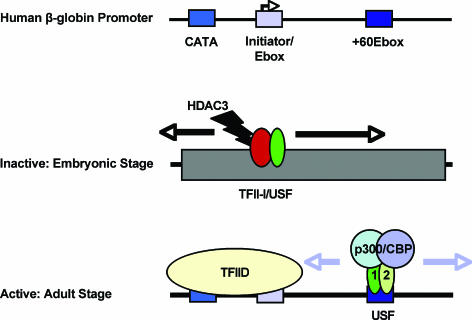
The human beta-globin genes are expressed in a developmental stage-specific manner in erythroid cells. Gene-proximal cis-regulatory DNA elements and interacting proteins restrict the expression of the genes to the embryonic, fetal, or adult stage of erythropoiesis. In addition, the relative order of the genes with respect to the locus control region contributes to the temporal regulation of the genes. We have previously shown that transcription factors TFII-I and USF interact with the beta-globin promoter in erythroid cells. Herein we demonstrate that reducing the activity of USF decreased beta-globin gene expression, while diminishing TFII-I activity increased beta-globin gene expression in erythroid cell lines. Furthermore, a reduction of USF activity resulted in a significant decrease in acetylated H3, RNA polymerase II, and cofactor recruitment to the locus control region and to the adult beta-globin gene. The data suggest that TFII-I and USF regulate chromatin structure accessibility and recruitment of transcription complexes in the beta-globin gene locus and play important roles in restricting beta-globin gene expression to the adult stage of erythropoiesis.


Figures

FIG. 1.
FIG. 1.
Schematic of the organizational structure of the human and murine β-globin gene loci. The human β-globin locus depicted on top consists of five genes which are expressed in a developmental stage-specific manner in erythroid cells as outlined. The expression of the genes is regulated by a locus control region composed of five DNase I HS and located about 15 to 27 kbp upstream of the embryonic ɛ-globin gene. The murine β-globin gene locus, which is depicted on the bottom, consists of four genes which are expressed either in erythroid cells of the embryonic yolk sac (EY or βH1) or in definitive erythroid cells derived from fetal liver or bone marrow hematopoiesis (βmaj and βmin). The murine LCR also contains multiple HS required for high-level globin gene expression.
FIG. 2.
FIG. 2.
Repression of β-globin gene expression by TFII-I. (A) Diagram outlining the experimental system for expressing wild-type or dominant-negative proteins. Coding sequences for TFII-I, p70, USF1, and A-USF are under the control of the CMV enhancer/promoter. A Tet operator sequence interacts with the Tet repressor, for which an expression construct is cotransfected into these cells. Doxycycline interacts with the Tet repressor and relieves repression. TRE, tetracycline-responsive element. (B) Analysis of TFII-I function in K562 cells. The expression of dominant-negative mutant p70 was induced in stably transfected K562 cells by using 1 μg doxycycline per ml culture medium for 12 h. The expression of p70 was analyzed by Western blotting (left panel). RNA was isolated from transfected cell lines, reverse transcribed, and analyzed by quantitative PCR for expression of the β-globin gene. β-Globin gene expression is presented as the ratio of expression in pTO/p70 cells using GAPDH as the internal reference, relative to expression in cells transfected with the pTO vector, which was set at 1. +, doxycycline-treated cells; +/−, pTO+Dox cells served as control for doxycycline-treated cells, and pTO-Dox served as control for untreated cells. (C and D) Analysis of TFII-I function in MEL cells. The expression of wild-type TFII-I (C) or the dominant-negative mutant p70 (D) was induced in stably transfected MEL cells lines by using 1 μg doxycycline per ml culture medium for 36 h. The expression of TFII-I or p70 was analyzed by Western blotting and/or RT-PCR analysis as indicated. For RT-PCR analysis of TFII-I expression, RNA was isolated from induced MEL cells harboring expression constructs for TFII-I or the empty vector pTO and converted to cDNA. The cDNA was analyzed by PCR with forward primers corresponding to the 3′ region of the p70 and TFII-I-coding region and the reverse bovine growth hormone primer hybridizing to the pTO vector. For gene expression analysis, RNA was isolated from transfected cell lines, reverse transcribed, and analyzed by quantitative PCR for the expression of the βmaj-globin gene. βmaj-Globin expression is presented as the ratio of expression in pTO/p70 or pTO/TFII-I cells and expression in pTO cells using GAPDH as the internal reference. Doxycycline-treated pTO MEL cells were used as controls for all studies in which protein expression was induced by doxycycline. Data marked with an asterisk have a P value above 0.05. Error bars indicate standard deviations.
FIG. 3.
FIG. 3.
TFII-I and HDAC3 are repressors of β-globin gene expression in K562 cells. (A) To determine transfection efficiency, K562 cells were nucleofected with 0.5 μg of siGLO RISC-free. Cells were collected on days 2 and 4, fixed, and stained with DAPI for nuclear visualization; siGLO is seen in red. (B) Knockdown of TFII-I, HDAC3, and USF2 proteins in K562 cells. K562 cells were nucleofected with 0.5 μg of siGENOME SMARTpool targeting either TFII-I, HDAC3, USF2, or 0.5 μg of siCONTROL nontargeting pool (Neg.) or mock transfected. A total of 20 μg of protein was run on gels from cells collected on day 2 for TFII-I and HDAC3 Western blots, and 10 μg of protein was loaded from cells collected on day 3 for the USF2 Western blot. Blots were probed with anti (α)-TFII-I (upper left panel), α-HDAC3 (upper middle panel), and α-USF2 (upper right panel). Blots were stripped and reprobed with α-GAPDH for loading control (bottom panels). (C) Relative β- and ɛ-globin expression of TFII-I, HDAC3, or USF2 knockdown K562 cells. On day 4, RNA was collected from K562 cells transfected as described above, reverse transcribed, and analyzed by real-time PCR. Expression is set relative to either nontargeting siRNA (Neg.) or mock-transfected cells, with GAPDH as the internal reference. Error bars indicate standard deviations.
FIG. 4.
FIG. 4.
Characterization of TFII-I- and USF-interacting proteins in K562 and MEL cells. (A) Coimmunoprecipitation experiment demonstrating interactions between TFII-I and HDAC3. K562 cells were lysed and subjected to immunoprecipitation (IP) with antibodies directed at either TFII-I or USF2. The precipitate was loaded onto a 7.5% denaturing polyacrylamide gel, and the gel was subjected to Western blotting with antibodies against HDAC3. The lane labeled no Ab represents the no-antibody control. (B) Double-ChIP experiment demonstrating simultaneous associations of TFII-I and HDAC3 with the β-globin gene promoter in K562 cells. K562 cells were subjected to ChIP using antibodies against TFII-I. The precipitate was subsequently immunoprecipitated with antibodies against HDAC3. The DNA in the second precipitate was purified and analyzed by PCR using primers specific for the human ɛ- or β-globin genes or for a region between LCR HS2 and -3. The lanes labeled no Ab2 represent samples from the no-antibody control experiments. (C) Coimmunoprecipitation of USF1, USF2, and TFII-I in K562 and MEL cells. K562 or MEL cell extract was precleared with anti (α)-rabbit IgG beads and precipitated with α-USF1, and complexes were captured by incubation with anti-rabbit IgG beads. Complexes were eluted off the beads with Laemmli buffer and incubation at 95°C for 10 min and loaded onto 10% Ready gels (Bio-Rad). After transfer, the membrane was cut into strips to probe with antibodies against either USF1, USF2, or TFII-I. The strips were then reassembled for phosphorimaging. The right panel is total extract from K562 or MEL cells run on a gel and subjected to Western blotting using an antibody against TFII-I. IP, immunoprecipitation.
FIG. 5.
FIG. 5.
USF activates β-globin gene expression in MEL cells. Stable MEL cell lines were created containing either A-USF (pTO/A-USF) or USF1 (pTO/USF1) and the Tet repressor (pTR). The expression of A-USF and USF1 was induced by incubating the cells with doxycycline and analyzed by Western-blotting experiments (A and C). βmaj-Globin gene expression in transfected cell lines was analyzed by quantitative RT-PCR, using the expression of GAPDH as an internal reference, and compared to the expression in cells transfected with the empty vector (pTO), whose expression level was set to 1. (A and B) Western blot analysis of A-USF expression (A) and analysis of β-globin gene expression (B) in MEL cells transfected with pTO/A-USF or pTO in the presence or absence of doxycycline as indicated. A-USF was detected using an antibody against the HA tag (α-HA), and USF1 was detected with a USF1-specific antibody. Error bars indicate standard deviations. (C and D) Western blot analysis of USF1 expression (C) and analysis of βmaj-globin gene expression (D) in MEL cells transfected with pTO/USF1 or pTO. USF1 was detected with a USF1-specific antibody. Data marked with an asterisk had P values above 0.05. + and +/− are as defined for Fig. 2.
FIG. 6.
FIG. 6.
Interactions of USF, RNA Pol II, p300, and modified histones with the β-globin gene locus in MEL cells expressing dominant-negative A-USF. (A) pTO/A-USF, pTR (A-USF), and pTO, pTR (control [Ctrl.]) MEL cells were induced with doxycycline. Cells were subjected to ChIP, immunoprecipitating with anti (α)-USF1, α-USF2, or no antibody (No Ab). Semiquantitative PCR was performed on samples, including input, using primers specific for the β-major promoter, HS2, or the ɛγ promoter. (B and C) MEL cells transfected with the A-USF expression vector (pTO/A-USF) or empty vector pTO were subjected to ChIP analysis with antibodies against AcH3 and RNA Pol II, or p300 (B). DNA was purified from the immunoprecipitate and analyzed by qPCR with primers specific for the βmaj-globin promoter and LCR element HS2. The error bars represent the results from two independent experiments. Ctrl represents either no antibody or nonspecific IgG antibody. (C) Results from pTO control cells are shown as white boxes. Results from pTO/A-USF cells are represented by black boxes. Samples described in the legend for panel B were analyzed with primers specific to the GAPDH promoter. All quantitative data were subjected to statistical analysis, and the P values were all below 0.05.
FIG. 7.
FIG. 7.
Interaction of USF and TFII-I with the β-globin gene locus during erythroid differentiation of murine embryonic stem cells. Murine embryonic stem cells were cultured and induced to differentiate as previously described by Levings et al. (24). At day 5, after the addition of erythropoietin, cells were collected and subjected to ChIP analysis using antibodies against dimethylated histone H3K4 (α-dimethyl H3K4), USF1, USF2, and TFII-I. IgG antibodies were used as negative controls in these experiments. The DNA was isolated from the precipitate and analyzed by PCR using sets of primers specific for LCR element HS2 and the βmaj-globin gene promoter.
FIG. 8.
FIG. 8.
Model for β-globin gene regulation by helix-loop-helix proteins USF and TFII-I. The β-globin promoter consists of a TATA-like sequence (CATA) located 25 bp upstream of the transcription start site, an initiator with an overlapping E-box, and a downstream E-box element located at +60. We propose that a protein complex containing TFII-I, HDAC3, and possibly other proteins interacts with the β-globin promoter in embryonic and fetal erythroid cells. The modification of histones by HDAC3 confers or maintains inaccessibility of the globin gene to the transcription complex. In adult cells, USF interacts with the β-globin promoter and recruits coactivator complexes that modify the chromatin structure to increase accessibility for transcription complexes.

References

    1. Armstrong, J. A., J. J. Bieker, and B. M. Emerson. 1998. A SWI/SNF related chromatin remodeling complex, E-RC1, is required for tissue-specific transcriptional regulation by EKLF in vitro. Cell 95:93-104. - PubMed
    1. Bender, M. A., J. N. Roach, J. Hallow, J. Close, R. Alami, E. E. Bouhassira, M. Groudine, and S. N. Fiering. 2001. Targeted deletion of 5′HS1 and 5′HS4 of the beta-globin locus control region reveals additive activity of the DNase I hypersensitive sites. Blood 98:2022-2027. - PubMed
    1. Bieker, J. J. 2001. Kruppel-like factors: three fingers in many pies. J. Biol. Chem. 276:34355-34358. - PubMed
    1. Bresnick, E. H., and G. Felsenfeld. 1993. Evidence that the transcription factor USF is a component of the human beta-globin locus control region heteromeric protein complex. J. Biol. Chem. 268:18824-18834. - PubMed
    1. Bulger, M., and M. Groudine. 1999. Looping versus linking: toward a model for long-distance gene activation. Genes Dev. 13:2465-2477. - PubMed

Publication types

MeSH terms

LinkOut - more resources