Comparative Study
. 2006 Aug 30;26(35):8931-42.
doi: 10.1523/JNEUROSCI.2173-06.2006.

Activation of pedunculopontine tegmental protein kinase A: a mechanism for rapid eye movement sleep generation in the freely moving rat

Affiliations
Comparative Study

Activation of pedunculopontine tegmental protein kinase A: a mechanism for rapid eye movement sleep generation in the freely moving rat

Ram S Bandyopadhya et al. J Neurosci. .

Abstract

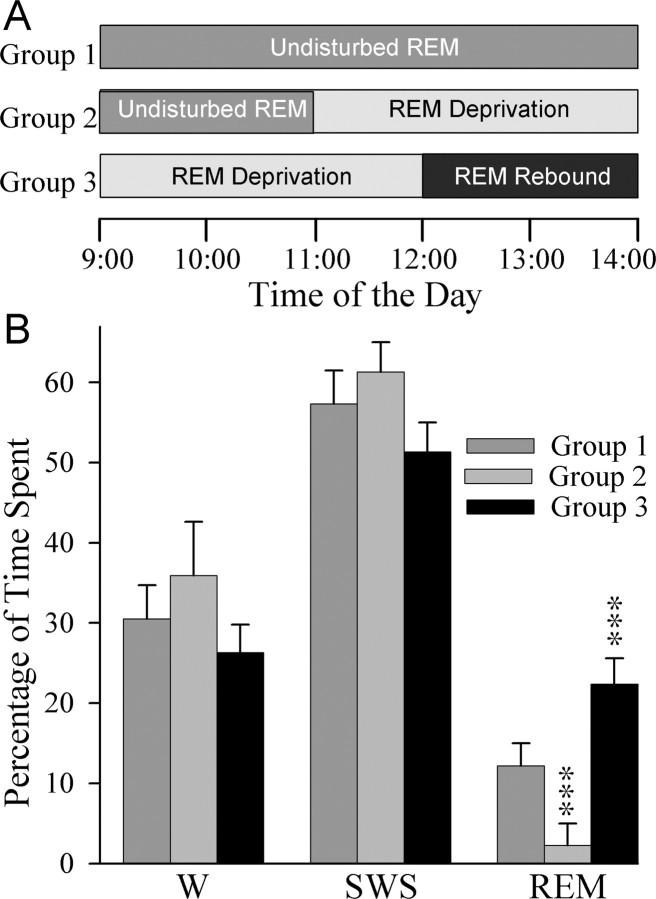
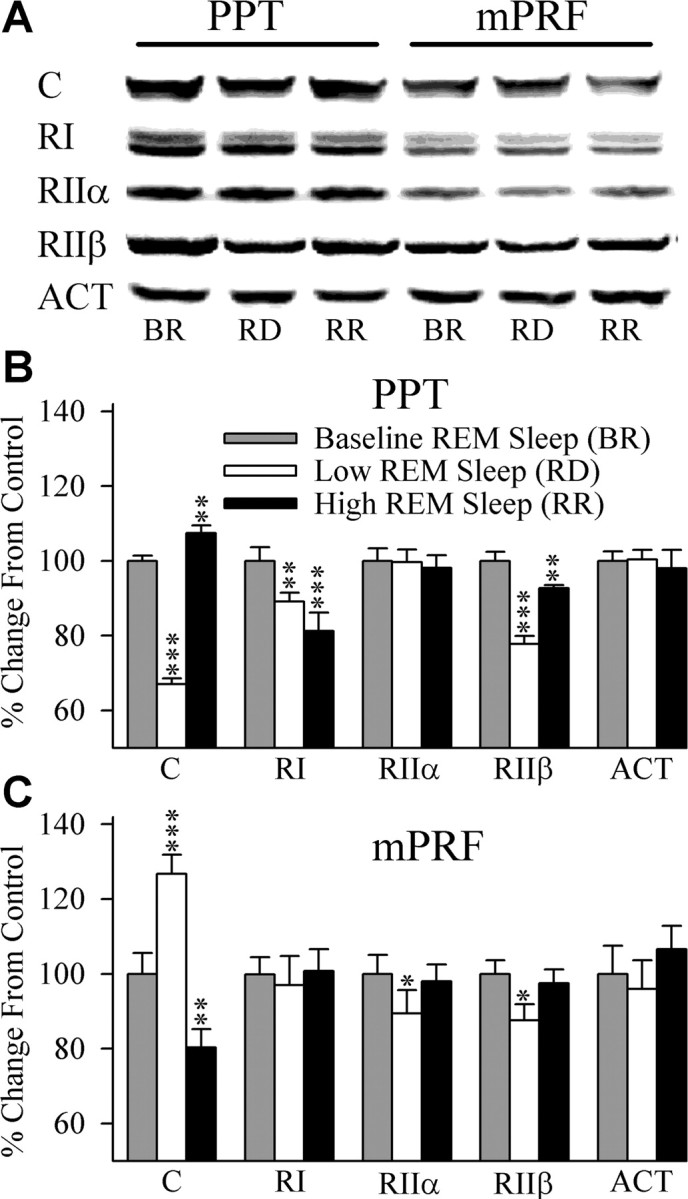
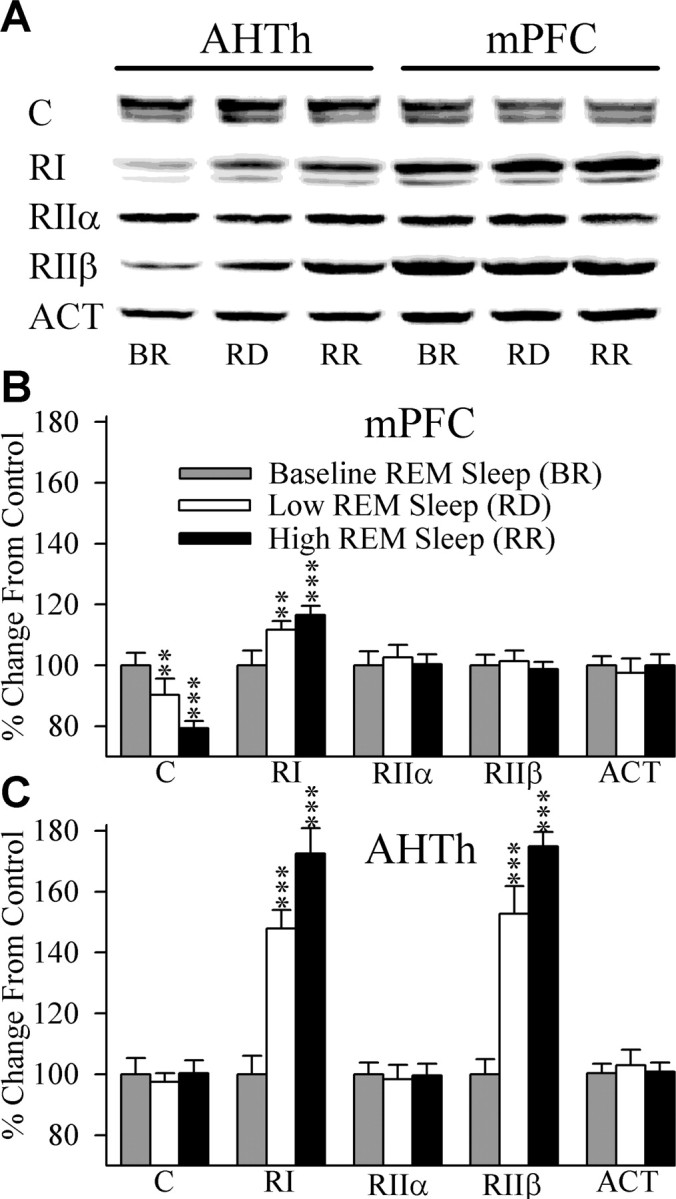
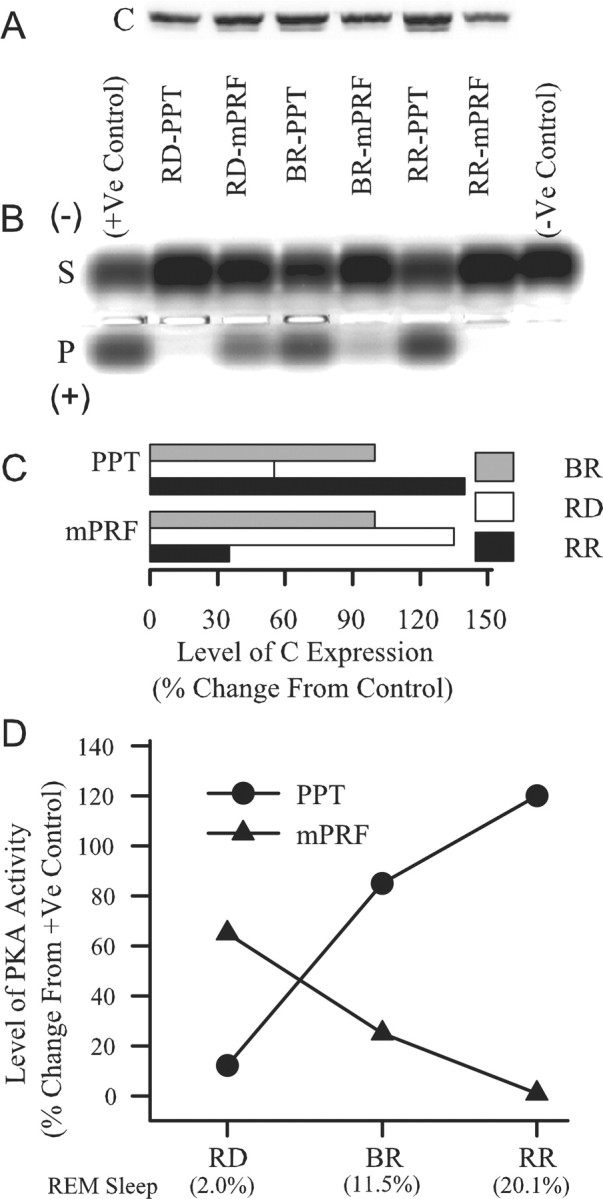
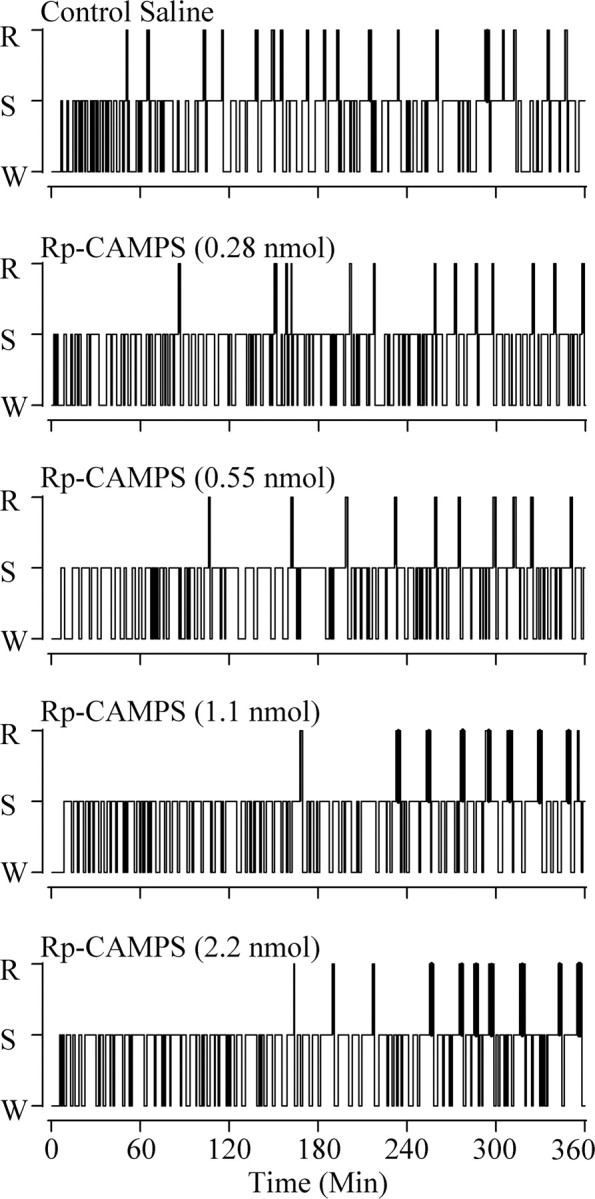
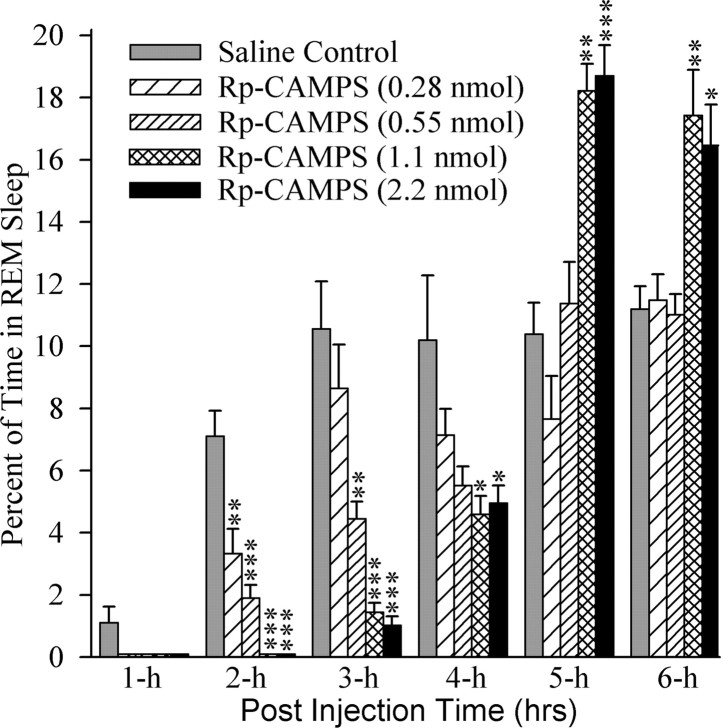
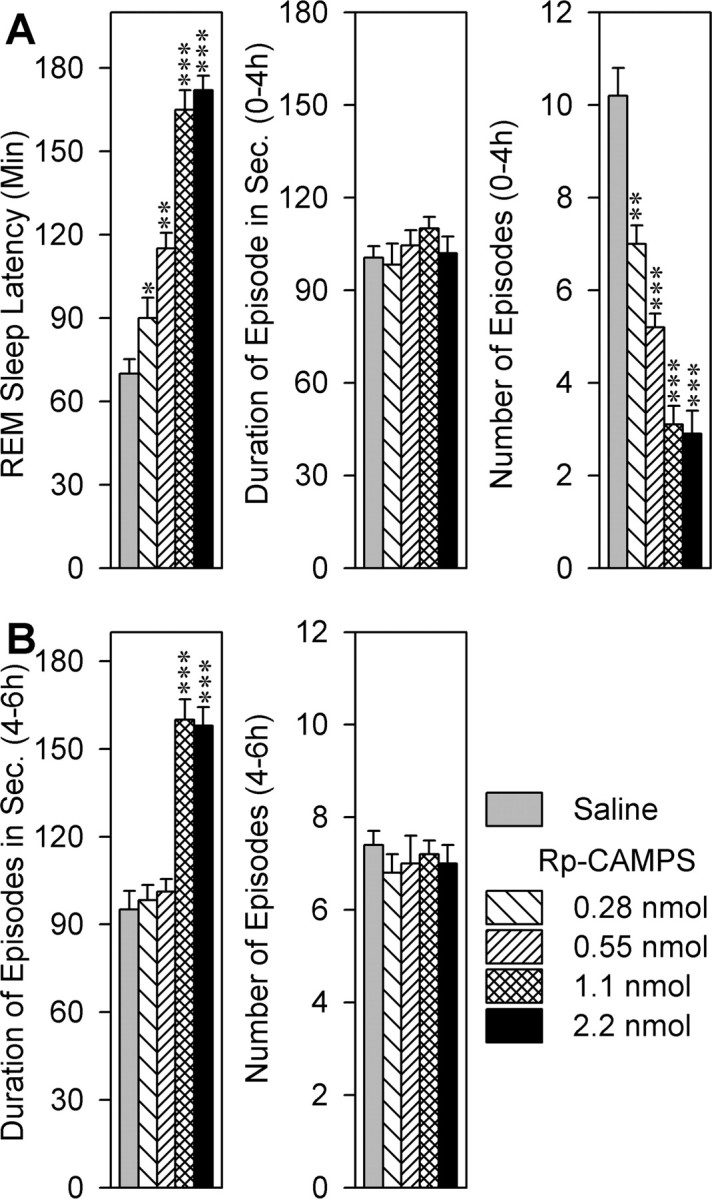
Cells in the pedunculopontine tegmentum (PPT) play a key role in the generation of rapid eye movement (REM) sleep, but its intracellular signaling mechanisms remain unknown. In the current studies, the role of PPT intracellular protein kinase A (PKA) in the regulation of REM sleep was evaluated by comparing PKA subunit [catalytic (PKA(C alpha)) and regulatory (PKA(RI), PKA(RII alpha), and PKA(RII beta)) types] expression and activity in the PPT at normal, high, and low REM sleep conditions. To compare anatomical specificity, REM sleep-dependent expressions of these PKA subunits were also measured in the medial pontine reticular formation (mPRF), medial prefrontal cortex (mPFC), and anterior hypothalamus (AHTh). The results of these PKA subunit expression and activity studies demonstrated that the expression of PKA(C alpha) and PKA activity in the PPT increased and decreased during high and low REM sleep, respectively. Conversely, PKA(C alpha) expression and PKA activity decreased with high REM sleep in the mPRF. Expression of PKA(C alpha) also decreased in the mPFC and remained unchanged in the AHTh with high REM sleep. These subunit expression and PKA activity data reveal a positive relationship between REM sleep and increased PKA activity in the PPT. To test this molecular evidence, localized activation of cAMP-dependent PKA activity was blocked using a pharmacological technique. The results of this pharmacological study demonstrated that the localized inhibition of cAMP-dependent PKA activation in the PPT dose-dependently suppressed REM sleep. Together, these results provide the first evidence that the activation of the PPT intracellular PKA system is involved in the generation of REM sleep.


Figures

Figure 1.
Figure 1.
Experimental designs for low and high REM sleep conditions. A, Group 1 rats were allowed to have a 5 h period (between 9:00 A.M. and 2:00 P.M.) of undisturbed sleep–wake (S–W) cycle with REM sleep. Group 2 rats were allowed to have undisturbed S–W cycle with REM sleep between 9:00 and 11:00 A.M., after which REM sleep episodes were selectively terminated between 11:00 A.M. and 2:00 P.M. REM sleep episodes in group 3 rats were selectively terminated from the ongoing S–W cycle between 9:00 A.M. and 12:00 P.M., followed by undisturbed S–W with REM sleep between 12:00 P.M. and 2:00 P.M. B, Histograms showing the total percentages of time (mean ± SD) spent in W, SWS, and REM sleep during the last 2 h (between 12:00 and 2:00 P.M.) of S–W data. Note that compared with group 1, group 2 rats had 77% less and group 3 rats had 84% more REM sleep during the last 2 h of S–W recordings. Therefore, in this study, group 1 rats were categorized as having a normal amount of REM sleep, whereas group 2 and group 3 rats were categorized as having low REM sleep and high REM sleep, respectively. Post hoc Scheffé's F test (compared with group 1), ***p < 0.001.
Figure 2.
Figure 2.
Anatomical location of analyzed microinjection sites. Schematic coronal sections through the brainstem are illustrated at levels 1.70, 1.20, 1.00, and 0.70 mm anterior (labeled at the top right of each section). Open circles (n = 7) indicate the location of control saline, and filled circles (n = 28) indicate the location of Rp-cAMPS injector tips. 4, Trochlear nucleus; Aq, aqueduct; ATg, anterior tegmental nucleus; BIC, nucleus brachium inferior colliculus; CG, central gray; CnF, cuneiform nucleus; ctg, central tegmental tract; DR, dorsal raphe nucleus; dtg, dorsal tegmental bundle; IC, inferior colliculus; InCo, intercollicular nucleus; LL, lateral lemniscus; Me5, mesencephalic trigeminal tract/nucleus; MiTg, microcellular tegmental nucleus; mlf, medial longitudinal fasciculus; Pa4, paratrochlear nucleus; PMR, paramedian raphe; PnO, pontine reticular nucleus, oral; RR, retrorubral nucleus; rs, rubrospinal tract; scp, superior cerebellar peduncle; SPTg, subpeduncular tegmental nucleus; ts, tectospinal tract; VTg, ventral tegmental nucleus; xscp, decussation of superior cerebellar peduncle. Scale bar, 600 μm.
Figure 3.
Figure 3.
Effects of high and low REM sleep on the levels of PKA subunit expression in the PPT and mPRF. A, Western blots of C, RI, RIIα, and RIIβ subunits of PKA and actin (ACT) in the PPT and mPRF during three conditions: BR, RD, and RR. B, Data from densitometric analysis of Western blots of PPT are expressed as a percentage of control. Each bar represents mean ± SD of the BR (gray bars), RD (white bars), or RR (black bars) group of animals (n = 6 rats per group). C, Data from densitometric analysis of Western blots of mPRF are expressed as a percentage of control. Note that PPT levels of C decreased during low REM sleep and increased during high REM sleep, whereas PPT levels of RI and RIIβ decreased in both sleep conditions. In the mPRF, low REM sleep increased levels of C and decreased levels of RIIα and RIIβ. Conversely, high REM sleep decreased levels of C in the mPRF. Also, note that levels of ACT in the PPT and mPRF remained unchanged in both sleep conditions. Post hoc Tukey's test (compared with control REM), *p < 0.05; **p < 0.01; ***p < 0.001.
Figure 4.
Figure 4.
Effects of high and low REM sleep on levels of expression of different PKA subunits in the AHTh and mPFC. A, Western blots of C, RI, RIIα, and RIIβ subunits of PKA and actin (ACT) in the AHTh and mPFC during three conditions: BR, RD, and RR. B, Data from densitometric analysis of Western blots of mPFC are expressed as a percentage of control. Each bar represents mean ± SD of the BR (gray bars), RD (white bars), or RR (black bars) group of animals (n = 6 rats per group). C, Data from densitometric analysis of Western blots of AHTh are expressed as a percentage of control. Note that during both low and high REM sleep, the mPFC levels of C decreased and RI increased. In the AHTh, the levels of RI and RIIβ increased during both low and high REM sleep. ACT levels in the mPFC and AHTh remained unchanged in both sleep conditions. Post hoc Tukey's test (compared with control REM), **p < 0.01; ***p < 0.001.
Figure 5.
Figure 5.
Effects of high and low REM sleep on the levels of PKA activity in the PPT and mPRF. A, Western blots of the PKA catalytic subunit in the PPT and mPRF during three conditions: BR, RD, and RR. Note that the PPT level of C increased during high REM sleep and decreased during low REM sleep, whereas in the mPRF, the level of C decreased during high REM sleep and increased during low REM sleep. B, Agarose gel showing the activity profile of the PKA (free C subunit of the PKA), visualized with UV light. The bottom band represents phosphorylated fluorescent-labeled Kemptide (P), and the top band represents the remaining unphosphorylated peptide (S). In the gel, phosphorylated product migrated toward the anode (+), and unphosphorylated peptide migrated toward the cathode (−). +Ve Control, Purified catalytic subunit of PKA (20 ng); −Ve Control, no protein or enzyme added; RD-PPT, PPT of low REM sleep rat (2 μg of protein); RD-mPRF, mPRF of low REM sleep rat (2 μg of protein); BR-PPT, PPT of basal/control REM sleep rat (2 μg of protein); BR-mPRF, mPRF of basal/control REM sleep rat (2 μg of protein); RR-PPT, PPT of high REM sleep rat (2 μg of protein); RR-mPRF, mPRF of high REM sleep rat (2 μg of protein). Lane labels apply to both A and B. C, Data from densitometric analysis of Western blots of PPT and mPRF during three conditions: BR, RD, RR. Data from densitometric analysis of Western blots in A are expressed as a percentage of control (density in the BR-PPT and BR-mPRF, 100% values for the PPT and mPRF respectively). D, Quantitative profiles of the PKA activity in the PPT and mPRF of RD rats (2.0% REM sleep), BR rats (11.5% REM sleep), and RR rats (20.1% REM sleep). To measure the level of PKA activities, initially, the OD of phosphorylated product in each lane of B was measured. Then, the OD of the experimental lanes was expressed as a percentage change from the OD in the +Ve control lane. Note that in the PPT, PKA activity increased during high REM sleep and decreased during low REM sleep. Conversely, in the mPRF, PKA activity increased during low REM sleep and decreased during high REM sleep.
Figure 6.
Figure 6.
Examples to show the changes in sleep–wake architecture after unilateral microinjection of different doses of Rp-cAMPS into the PPT. These five hypnograms from five different rats plotted as step histograms plot the occurrence and duration of polygraphically defined W, SWS (S), and REM sleep (R) after control vehicle and four different doses of Rp-cAMPS. All microinjections were made at 10:00 A.M. (0 min) and were followed by 6 h of continuous recording.
Figure 7.
Figure 7.
REM sleep after microinjections of control saline or one of four different doses of Rp-cAMPS into the PPT. Bars represent percentages (mean ± SD) of REM sleep during each hour of the 6 h period after a single injection of saline control or 0.28, 0.55, 1.1, and 2.2 nmol of Rp-cAMPS. Note the dose-dependent decrease of REM sleep during the first 4 h after Rp-cAMPS microinjection. Also note the increased REM sleep during the fifth and sixth hours after 1.1 and 2.2 nmol doses of Rp-cAMPS. This increased REM sleep after higher doses of Rp-cAMPS is a rebound effect. Asterisks indicate the levels of statistical significance (Scheffé's F test) of the differences relative to control saline (*p < 0.05; **p < 0.01; ***p < 0.001).
Figure 8.
Figure 8.
Effects on the latency, total number, and mean duration of REM sleep episodes observed after microinjection of saline or one of four different doses of Rp-cAMPS into the PPT. Data are presented as mean ± SE. A, Note that compared with the control saline, microinjections of Rp-cAMPS dose-dependently increased latency for the first episode of REM sleep and decreased the number of REM sleep episodes during the first 4 h (0–4 h). B, Also note that during the last 2 h (4–6 h) after microinjection of 1.1 and 2.2 nmol Rp-cAMPS, the duration of REM sleep episodes increased. Asterisks indicate the levels of statistical significance (Scheffé's F test) of the differences relative to control saline (*p < 0.05; **p < 0.01; ***p < 0.001).

References

    1. Ahnaou A, Basille M, Gonzalez B, Vaudry H, Hamon M, Adrien J, Bourgin P. Long-term enhancement of REM sleep by the pituitary adenylyl cyclase-activating polypeptide (PACAP) in the pontine reticular formation of rat. Eur J Neurosci. 1999;11:4051–4058. - PubMed
    1. Borrelli E, Montmayeur JP, Foulkes NS, Sassone-Corsi P. Signal transduction and gene control: the cAMP pathway. Crit Rev Oncog. 1992;3:321–338. - PubMed
    1. Bradford M. A rapid and sensitive method for the quantification of microgram quantities of protein utilizing the principle of protein dye binding. Anal Biochem. 1976;72:248–254. - PubMed
    1. Capece ML, Lydic R. cAMP and protein kinase A modulate cholinergic rapid eye movement sleep generation. Am J Physiol. 1997;273:R1430–R1440. - PubMed
    1. Cook SA, Welch SP, Lichtman AH, Martin BR. Evaluation of cAMP involvement in cannabinoid-induced antinociception. Life Sci. 1995;56:2049–2056. - PubMed

Publication types

MeSH terms

LinkOut - more resources