

Heart rate turbulence: a review
Indian Pacing Electrophysiol J.
.
No abstract available
Figures
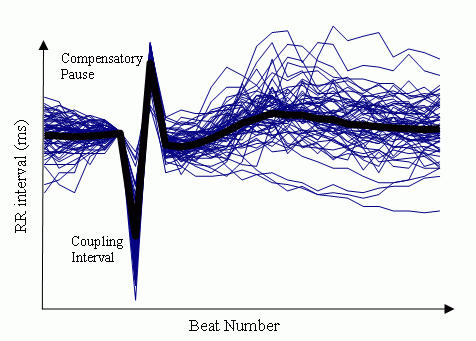
Example of RR interval sequences in one patient (thin lines), all aligned at the VPC. The thick line shows the average of the 60 sequences. Figure supplied courtesy of Dr. Georg Schmidt.
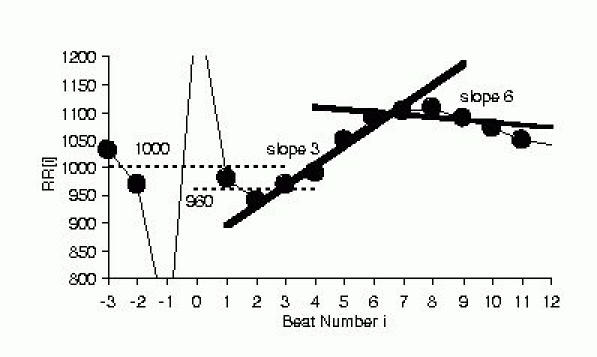
Schematic figure showing measurement of TO and TS. TO is the difference in the average of the 2 RR intervals preceding and succeeding the VPC/compensatory pause sequence expressed as a percentage. In the example shown, TO= - 4% from 100 x (960-1000)/1000. TS is the maximum of regression slopes computed for 5 consecutive RR sequences. In the example, the regression lines for beats 3~7 (slope 3) and beats 6~10 (slope 6) are shown, and TS was 36.4 because slope 3 had the largest slope of 36.4 ms/beat number among slopes 1 through 16.
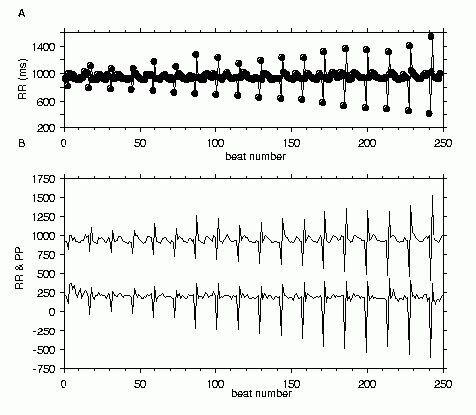
Induced HRT. Panel A. RR intervals from a patient undergoing clinical electrophysiology study for supraventricular tachycardia. A stimulus was delivered at the RV apex after 20 sinus beats at various coupling intervals shorter than the baseline RR interval. Only the RR for the 2 beats before and 10 beats after the extrastimulus and compensatory pause are shown for each extrastimulus. Panel B. The RR data from panel A and pulse pressure (systolic - diastolic blood pressure) for the same beats are shown together. The pulse pressure was multiplied by 10 and shifted down by 800 mmHg so as not to overlap with the RR data.
Similar articles
-
Heart rate turbulence.Prog Cardiovasc Dis. 2013 Sep-Oct;56(2):160-71. doi: 10.1016/j.pcad.2013.08.002. Epub 2013 Aug 29. Prog Cardiovasc Dis. 2013. PMID: 24215748 Review.
-
Heart rate turbulence after ventricular premature beats in healthy Doberman pinschers and those with dilated cardiomyopathy.J Vet Cardiol. 2017 Oct;19(5):421-432. doi: 10.1016/j.jvc.2017.08.005. Epub 2017 Sep 25. J Vet Cardiol. 2017. PMID: 28958795
-
The use of heart rate turbulence and heart rate variability in the assessment of autonomic regulation and circadian rhythm in patients with systemic lupus erythematosus without apparent heart disease.Lupus. 2018 Mar;27(3):436-444. doi: 10.1177/0961203317725590. Epub 2017 Aug 10. Lupus. 2018. PMID: 28795655
-
Cardiac autonomic function in type 1 and type 2 myotonic dystrophy.Clin Auton Res. 2017 Jun;27(3):193-202. doi: 10.1007/s10286-017-0413-y. Epub 2017 Mar 20. Clin Auton Res. 2017. PMID: 28321519
-
[Heart rate turbulence--a new predictor of sudden cardiac death].Pol Merkur Lekarski. 2007 Jul;23(133):55-9. Pol Merkur Lekarski. 2007. PMID: 18051831 Review. Polish.
Cited by
-
Role of editing of R-R intervals in the analysis of heart rate variability.Front Physiol. 2012 May 23;3:148. doi: 10.3389/fphys.2012.00148. eCollection 2012. Front Physiol. 2012. PMID: 22654764 Free PMC article.
-
Heart rate turbulence measurements in patients with dipper and non-dipper hypertension: the effects of autonomic functions.Turk J Med Sci. 2021 Dec 13;51(6):3030-3037. doi: 10.3906/sag-2105-177. Turk J Med Sci. 2021. PMID: 34590797 Free PMC article.
-
Cardiac autonomic function in metabolic syndrome: a comparison of ethnic Turkish and Japanese patients.J Interv Card Electrophysiol. 2012 Dec;35(3):253-8. doi: 10.1007/s10840-012-9741-y. Epub 2012 Oct 19. J Interv Card Electrophysiol. 2012. PMID: 23080331
-
Heart rate turbulence for guiding electric therapy in patients with cardiac failure.J Clin Monit Comput. 2010 Apr;24(2):125-9. doi: 10.1007/s10877-009-9218-4. Epub 2010 Jan 16. J Clin Monit Comput. 2010. PMID: 20082123
-
Impact of preceding ventricular premature beats on heart rate turbulence.Ann Noninvasive Electrocardiol. 2009 Oct;14(4):333-9. doi: 10.1111/j.1542-474X.2009.00322.x. Ann Noninvasive Electrocardiol. 2009. PMID: 19804509 Free PMC article.
References
-
- Roach D, Koshman ML, Sheldon R. Turbulence: a focal, inducible, source of heart period variability associated with induced, transient hypertension. PACE. 2000;23:709.
-
- Schmidt G, Malik M, Barthel P, et al. Heart-rate turbulence after ventricular premature beats as a predictor of mortality after acute myocardial infarction. Lancet. 1999;353:1390–1396. - PubMed
-
- Bauer A, Barthel P, Schneider R, et al. Impact of coupling interval on heart rate turbulence. Eur Heart J. 2001;22(22):438. P2324.
-
- Bauer A, Barthel P, Schneider R, et al. Dynamics of heart rate turbulence. Circulation. 2001;104(Supplement):II-339. 1622.
-
- Watanabe MA, Josephson ME. Heart rate turbulence in the spontaneous ventricular tachy-arrhythmia database. PACE. 2000;23:686.
LinkOut - more resources
Full Text Sources