Functional neural circuits for mental timekeeping
- PMID: 16944489
- PMCID: PMC6871423
- DOI: 10.1002/hbm.20285
Functional neural circuits for mental timekeeping
Abstract
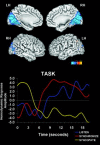
Theories of mental timekeeping suggest frontostriatal networks may mediate performance of tasks requiring precise timing. We assessed whether frontostriatal networks are functionally integrated during the performance of timing tasks. Functional magnetic resonance imaging (fMRI) data from 31 healthy adults were collected during performance of several different types of discrete interval timing tasks. Independent component analysis (ICA) was used to examine functional connectivity within frontostriatal circuits. ICA identifies groups of spatially discrete brain regions sharing similar patterns of hemodynamic signal change over time. The results confirm the existence of a frontostriatal neural timing circuit that includes anterior cingulate gyrus, supplementary motor area, bilateral anterior insula, bilateral putamen/globus pallidus, bilateral thalamus, and right superior temporal gyrus and supramarginal gyrus. Several other distinct neural circuits were identified that may represent the neurobiological substrates of different information processing stages of mental timekeeping. Small areas of right cerebellum were engaged in several of these circuits, suggesting that cerebellar function may be important in, but not the primary substrate of, the mental timing tasks used in this experiment. These findings are discussed within the context of current biological and information processing models of neural timekeeping.
Figures


Similar articles
-
Modulation of neural circuits underlying temporal production by facial expressions of pain.PLoS One. 2018 Feb 15;13(2):e0193100. doi: 10.1371/journal.pone.0193100. eCollection 2018. PLoS One. 2018. PMID: 29447256 Free PMC article.
-
The functional anatomy of inspection time: an event-related fMRI study.Neuroimage. 2004 Aug;22(4):1466-79. doi: 10.1016/j.neuroimage.2004.03.047. Neuroimage. 2004. PMID: 15275904
-
A parametric fMRI investigation of context effects in sensorimotor timing and coordination.Neuropsychologia. 2007 Mar 2;45(4):673-84. doi: 10.1016/j.neuropsychologia.2006.07.020. Epub 2006 Oct 2. Neuropsychologia. 2007. PMID: 17014871 Free PMC article.
-
Understanding time perception through non-invasive brain stimulation techniques: A review of studies.Behav Brain Res. 2020 Jan 13;377:112232. doi: 10.1016/j.bbr.2019.112232. Epub 2019 Sep 14. Behav Brain Res. 2020. PMID: 31526769
-
The functional role of cross-frequency coupling.Trends Cogn Sci. 2010 Nov;14(11):506-15. doi: 10.1016/j.tics.2010.09.001. Trends Cogn Sci. 2010. PMID: 20932795 Free PMC article. Review.
Cited by
-
Time-scale invariance as an emergent property in a perceptron with realistic, noisy neurons.Behav Processes. 2013 May;95:60-70. doi: 10.1016/j.beproc.2013.02.015. Epub 2013 Mar 18. Behav Processes. 2013. PMID: 23518297 Free PMC article. Review.
-
The neural bases for timing of durations.Nat Rev Neurosci. 2022 Nov;23(11):646-665. doi: 10.1038/s41583-022-00623-3. Epub 2022 Sep 12. Nat Rev Neurosci. 2022. PMID: 36097049 Review.
-
An automated method for identifying artifact in independent component analysis of resting-state FMRI.Front Hum Neurosci. 2013 Jul 10;7:343. doi: 10.3389/fnhum.2013.00343. eCollection 2013. Front Hum Neurosci. 2013. PMID: 23847511 Free PMC article.
-
Age-Related Atrophy and Compensatory Neural Networks in Reading Comprehension.J Int Neuropsychol Soc. 2019 Jul;25(6):569-582. doi: 10.1017/S1355617719000274. Epub 2019 Apr 29. J Int Neuropsychol Soc. 2019. PMID: 31030698 Free PMC article.
-
De-noising with a SOCK can improve the performance of event-related ICA.Front Neurosci. 2014 Sep 19;8:285. doi: 10.3389/fnins.2014.00285. eCollection 2014. Front Neurosci. 2014. PMID: 25285065 Free PMC article.
References
-
- Assad JA (2003): Neural coding of behavioral relevance in parietal cortex. Curr Opin Neurobiol 13:194–197. - PubMed
-
- Babiloni C, Babiloni F, Carducci F, Cincotti F, Vecchio F, Cola B, Rossi S, Miniussi C, Rossini PM (2004): Functional frontoparietal connectivity during short‐term memory as revealed by high‐resolution EEG coherence analysis. Behav Neurosci 118:687–697. - PubMed
-
- Behrmann M, Geng JJ, Shomstein S (2004): Parietal cortex and attention. Curr Opin Neurobiol 14:212–217. - PubMed
-
- Bell AJ, Sejnowski TJ (1995): An information‐maximization approach to blind separation and blind deconvolution. Neural Comput 7:1129–1159. - PubMed
-
- Biswal B, Yetkin FZ, Haughton VM, Hyde JS (1995): Functional connectivity in the motor cortex of resting human brain using echo‐planar MRI. Magn Reson Med 34:537–541. - PubMed
MeSH terms
Substances
LinkOut - more resources
Full Text Sources
Miscellaneous

