

Methods for evaluating clustering algorithms for gene expression data using a reference set of functional classes
- PMID: 16945146
- PMCID: PMC1590054
- DOI: 10.1186/1471-2105-7-397
Methods for evaluating clustering algorithms for gene expression data using a reference set of functional classes
Abstract
Background: A cluster analysis is the most commonly performed procedure (often regarded as a first step) on a set of gene expression profiles. In most cases, a post hoc analysis is done to see if the genes in the same clusters can be functionally correlated. While past successes of such analyses have often been reported in a number of microarray studies (most of which used the standard hierarchical clustering, UPGMA, with one minus the Pearson's correlation coefficient as a measure of dissimilarity), often times such groupings could be misleading. More importantly, a systematic evaluation of the entire set of clusters produced by such unsupervised procedures is necessary since they also contain genes that are seemingly unrelated or may have more than one common function. Here we quantify the performance of a given unsupervised clustering algorithm applied to a given microarray study in terms of its ability to produce biologically meaningful clusters using a reference set of functional classes. Such a reference set may come from prior biological knowledge specific to a microarray study or may be formed using the growing databases of gene ontologies (GO) for the annotated genes of the relevant species.
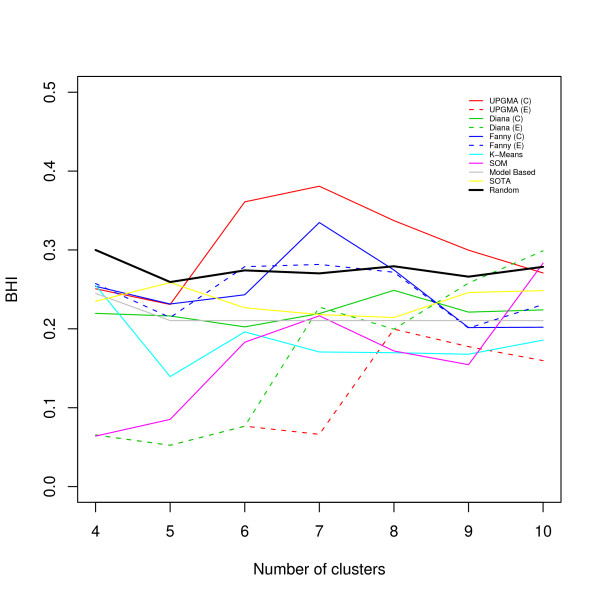
Results: In this paper, we introduce two performance measures for evaluating the results of a clustering algorithm in its ability to produce biologically meaningful clusters. The first measure is a biological homogeneity index (BHI). As the name suggests, it is a measure of how biologically homogeneous the clusters are. This can be used to quantify the performance of a given clustering algorithm such as UPGMA in grouping genes for a particular data set and also for comparing the performance of a number of competing clustering algorithms applied to the same data set. The second performance measure is called a biological stability index (BSI). For a given clustering algorithm and an expression data set, it measures the consistency of the clustering algorithm's ability to produce biologically meaningful clusters when applied repeatedly to similar data sets. A good clustering algorithm should have high BHI and moderate to high BSI. We evaluated the performance of ten well known clustering algorithms on two gene expression data sets and identified the optimal algorithm in each case. The first data set deals with SAGE profiles of differentially expressed tags between normal and ductal carcinoma in situ samples of breast cancer patients. The second data set contains the expression profiles over time of positively expressed genes (ORF's) during sporulation of budding yeast. Two separate choices of the functional classes were used for this data set and the results were compared for consistency.
Conclusion: Functional information of annotated genes available from various GO databases mined using ontology tools can be used to systematically judge the results of an unsupervised clustering algorithm as applied to a gene expression data set in clustering genes. This information could be used to select the right algorithm from a class of clustering algorithms for the given data set.
Figures


Similar articles
-
Evaluation of clustering algorithms for gene expression data.BMC Bioinformatics. 2006 Dec 12;7 Suppl 4(Suppl 4):S17. doi: 10.1186/1471-2105-7-S4-S17. BMC Bioinformatics. 2006. PMID: 17217509 Free PMC article.
-
Attribute clustering for grouping, selection, and classification of gene expression data.IEEE/ACM Trans Comput Biol Bioinform. 2005 Apr-Jun;2(2):83-101. doi: 10.1109/TCBB.2005.17. IEEE/ACM Trans Comput Biol Bioinform. 2005. PMID: 17044174
-
Clustering of gene expression data: performance and similarity analysis.BMC Bioinformatics. 2006 Dec 12;7 Suppl 4(Suppl 4):S19. doi: 10.1186/1471-2105-7-S4-S19. BMC Bioinformatics. 2006. PMID: 17217511 Free PMC article.
-
Unsupervised pattern recognition: an introduction to the whys and wherefores of clustering microarray data.Brief Bioinform. 2005 Dec;6(4):331-43. doi: 10.1093/bib/6.4.331. Brief Bioinform. 2005. PMID: 16420732 Review.
-
Comparing algorithms for clustering of expression data: how to assess gene clusters.Methods Mol Biol. 2009;541:479-509. doi: 10.1007/978-1-59745-243-4_21. Methods Mol Biol. 2009. PMID: 19381534 Review.
Cited by
-
CellBIC: bimodality-based top-down clustering of single-cell RNA sequencing data reveals hierarchical structure of the cell type.Nucleic Acids Res. 2018 Nov 30;46(21):e124. doi: 10.1093/nar/gky698. Nucleic Acids Res. 2018. PMID: 30102368 Free PMC article.
-
Synergies of Radiomics and Transcriptomics in Lung Cancer Diagnosis: A Pilot Study.Diagnostics (Basel). 2023 Feb 15;13(4):738. doi: 10.3390/diagnostics13040738. Diagnostics (Basel). 2023. PMID: 36832225 Free PMC article.
-
Identifying large-scale interaction atlases using probabilistic graphs and external knowledge.J Clin Transl Sci. 2022 Feb 11;6(1):e27. doi: 10.1017/cts.2022.18. eCollection 2022. J Clin Transl Sci. 2022. PMID: 35321220 Free PMC article.
-
New resampling method for evaluating stability of clusters.BMC Bioinformatics. 2008 Jan 24;9:42. doi: 10.1186/1471-2105-9-42. BMC Bioinformatics. 2008. PMID: 18218074 Free PMC article.
-
Mining the modular structure of protein interaction networks.PLoS One. 2015 Apr 9;10(4):e0122477. doi: 10.1371/journal.pone.0122477. eCollection 2015. PLoS One. 2015. PMID: 25856434 Free PMC article.
References
-
- Datta S, Arnold J. Some comparisons of clustering and classification techniques applied to transcriptional profiling data. In: Gulati C, Lin YX, Mishra S, Rayner J, editor. Advances in Statistics, Combinatorics and Related Areas. World Scientific; 2002. pp. 63–74.
-
- Sneath PH, Snokal RR. Numerical Taxonomy. Freeman; 1973.
Publication types
MeSH terms
LinkOut - more resources
Full Text Sources
Molecular Biology Databases
Research Materials
Miscellaneous
