. 2006 Sep 12;103(37):13783-8.
doi: 10.1073/pnas.0604006103. Epub 2006 Aug 31.

Hmgb3 regulates the balance between hematopoietic stem cell self-renewal and differentiation

Affiliations

Hmgb3 regulates the balance between hematopoietic stem cell self-renewal and differentiation

Michael J Nemeth et al. Proc Natl Acad Sci U S A. .

Abstract

Hmgb3 is an X-linked member of a family of sequence-independent chromatin-binding proteins that is preferentially expressed in hematopoietic stem cells (HSC). Hmgb3-deficient mice (Hmgb3(-/Y)) contain normal numbers of HSCs, capable of self-renewal and hematopoietic repopulation, but fewer common lymphoid (CLP) and common myeloid progenitors (CMP). In this study, we tested the hypothesis that Hmgb3(-/Y) HSCs are biased toward self-renewal at the expense of progenitor production. Wild-type and Hmgb3(-/Y) CLPs and CMPs proliferate and differentiate equally in vitro, indicating that CLP and CMP function normally in Hmgb3(-/Y) mice. Hmgb3(-/Y) HSCs exhibit constitutive activation of the canonical Wnt signaling pathway, which regulates stem cell self-renewal. Increased Wnt signaling in Hmgb3(-/Y) HSCs corresponds to increased expression of Dvl1, a positive regulator of the canonical Wnt pathway. To induce hematopoietic stress and a subsequent response from HSCs, we treated Hmgb3(-/Y) mice with 5-fluorouracil. Hmgb3(-/Y) mice exhibit a faster recovery of functional HSCs after administration of 5-fluorouracil compared with wild-type mice, which may be due to the increased Wnt signaling. Furthermore, the recovery of HSC number in Hmgb3(-/Y) mice occurs more rapidly than CLP and CMP recovery. From these data, we propose a model in which Hmgb3 is required for the proper balance between HSC self-renewal and differentiation.


Conflict of interest statement

Conflict of interest statement: No conflicts declared.

Figures

Fig. 1.
Fig. 1.
Expansion of CLP and CMP in vitro. (A) Mean CFU-Pre-B frequency generated from CLPs (lin, c-kitLO, Sca-1LO, and IL-7Rα+) before (day 0) and after 5 days in culture (day 5). CFU-Pre-B frequency was determined by scoring CFU-Pre-B per 1 × 10⁴ CLP at day 0 and at day 5. Wild-type, n = 12, 212 colonies counted on day 0, 1,038 colonies counted on day 5; Hmgb3−/Y, n = 12, 306 colonies counted on day 0, 1,563 colonies counted on day 5. The data represent the pooled results of three independent experiments. Error bars represent standard deviations. (B) Mean CFU-GM frequency generated from CMPs (lin, c-kit+, Sca-1, and IL-7Rα) before (day 0) and after 5 days in culture (day 5). CFU-GM frequency was determined by scoring CFU-GM per 1,000 CMP at day 0 and at day 5. Wild-type, n = 12, 646 colonies counted on day 0, 1,755 colonies counted on day 5; Hmgb3−/Y, n = 12, 377 colonies counted on day 0, 1,854 colonies counted on day 5. The data represent the pooled results of three independent experiments. Error bars represent standard deviations. (C) Average expansion in CFU generated by CLP and CMP before and after 5 days in culture (n = 3). The expansion in the number of CFU for each individual experiment was calculated by dividing the average CFU frequency at day 5 by the average CFU frequency at day 0. Error bars represent standard error of the mean. P values were generated by Student's t test.
Fig. 2.
Fig. 2.
Increased canonical Wnt signaling in Hmgb3−/Y HSCs after 5-FU treatment. (A) (Left) Semiquantitative duplex RT-PCR analysis of β-galactosidase mRNA in TOPGAL (wild-type) and TOPGAL × Hmgb3−/Y HSCs (lin, SP+, c-kitHI, Sca-1HI, and IL-7Rα). Test gene mRNA levels were quantified within the linear range of amplification by densitometry and normalized to β2-microglobulin expression. (Right) β-Galactosidase mRNA levels relative to β2-microglobulin. The amount of β-galactosidase (lacZ) mRNA in TOPGAL (n = 3) and TOPGAL × Hmgb3−/Y (n = 3) HSCs was normalized to β2-microglobulin mRNA (β2) by the formula (densitometry value, test; densitometry value, β2-microglobulin). The normalized TOPGAL β-galactosidase mRNA level was then set to 1. The data represent the pooled results of three independent experiments by using mRNA isolated from sorted HSCs pooled from three mice. P values were determined by Student's t test. (B) (Left) Semiquantitative duplex RT-PCR analysis of Dvl1 mRNA in wild-type TOPGAL and TOPGAL × Hmgb3−/Y HSCs (lin, SP+, c-kitHI, Sca-1HI, and IL-7Rα). Test gene mRNA levels were quantified within the linear range of amplification by densitometry and normalized to β2-microglobulin expression. (Right) Dvl1 mRNA levels relative to β2-microglobulin. The amount of Dvl1 mRNA in TOPGAL (n = 3) and TOPGAL × Hmgb3−/Y (n = 3) HSCs was normalized to β2-microglobulin mRNA as described above.
Fig. 3.
Fig. 3.
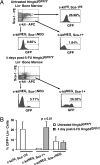
Analysis of Hmgb3 expression in primitive hematopoietic cells after 5-FU. (A) Representative FACS analysis of GFP+ cells within various c-kit and Sca-1 populations in lin bone marrow cells isolated from untreated Hmgb3GFP/Y mice and from Hmgb3GFP/Y mice 4 days after 5-FU administration. Regions were drawn based on isotype controls. (B) Average percentage of GFP+ cells in lin populations (c-kitHI, Sca-1HI; c-kitNEG, Sca-1+; c-kitNEG, and Sca-1NEG) from untreated Hmgb3GFP/Y mice and from Hmgb3GFP/Y mice 4 days after 5-FU administration. Bone marrow cells from three mice were pooled for each independent experiment; data represent the average of three experiments. Error bars represent standard deviation. P values were generated by Student's t test.
Fig. 4.
Fig. 4.
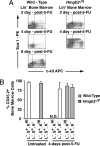
Analysis of competitive repopulation assays. (A) Representative FACS profiles of c-kit+ and Sca-1+ populations within lin bone marrow cells isolated from wild-type and Hmgb3−/Y mice 2, 4, and 8 days after treatment with 5-FU. Regions were drawn based on isotype controls. (B) FACS analysis was performed on bone marrow cells to determine the contribution to hematopoietic repopulation made by lin, Sca-1+, c-kitHI, or c-kitNEG cells (CD45.2) isolated from untreated wild-type (c-kitHI, n = 3; c-kitNEG, n = 3) and Hmgb3−/Y (c-kitHI, n = 3; c-kitNEG, n = 3) mice and wild-type (c-kitNEG, n = 8) and Hmgb3−/Y (c-kitHI, n = 8; c-kitNEG, n = 8) mice 4 days after 5-FU treatment. No experiment was performed by using c-kitHI cells from wild-type mice 4 days after 5-FU treatment (ND) because of the lack of cells. Error bars represent standard deviation.
Fig. 5.
Fig. 5.
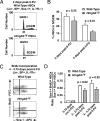
Analysis of cell cycle status of Hmgb3−/Y HSCs after 5-FU. (A) Representative cell cycle histograms obtained through propidium iodide staining of HSCs (lin, SP+, Sca-1+, and IL-7Rα) isolated from wild-type and Hmgb3−/Y mice 4 days after 5-FU administration. Staining was performed on HSCs pooled from five mice for each group. Histograms were analyzed as described in Materials and Methods. (B) Average percentage of wild-type and Hmgb3−/Y HSCs in S/G2/M phases of the cell cycle. HSCs were isolated from untreated wild-type and Hmgb3−/Y mice and from wild-type and Hmgb3−/Y mice 2 and 4 days after 5-FU administration. Data represent the average of three independent experiments for each group. Error bars represent standard deviation. P values were generated by Student's t test. (C) Representative FACS analysis of Sca-1+ and BrdU+ populations in lin, SP+, and IL-7Rα cells isolated from wild-type and Hmgb3−/Y mice treated with 5-FU. Regions were drawn based on isotype controls. These analyses were performed on mice that were pulsed with a single dose of BrdU 4 days after treatment with 5-FU. Analyses were performed 18 h later, therefore Sca-1+ and BrdU+ cells represent HSCs that incorporated BrdU within the 18-h window. (D) Ratios of BrdU+ to BrdU HSCs (defined as lin, SP+, and IL-7Rα that were also Sca-1+) in untreated wild-type and Hmgb3−/Y mice (18-h window) and in wild-type and Hmgb3−/Y mice 2 days (BrdU pulse present for 2–2.75 days; n = 3) and 4 days (BrdU pulse present for 4–4.75 days; n = 4) after 5-FU treatment. Ratios were determined by the formula (no. BrdU+ Sca-1+ events/no. BrdU Sca-1+ events). Error bars represent standard deviations. P values were generated by Student's t test.
Fig. 6.
Fig. 6.
Analysis of Hmgb3−/Y primitive hematopoietic cells after 5-FU treatment. (A) Average percentages of phenotypic primitive hematopoietic cells detected by FACS analysis in lin cells isolated from untreated wild-type and Hmgb3−/Y mice and from wild-type and Hmgb3−/Y mice 2, 4, and 8 days after 5-FU treatment (n = 4 for all groups). (Upper) HSC (lin, c-kitHI, Sca-1HI, and IL-7Rα). (Lower Left) CLP (lin, c-kitLO, Sca-1LO, and IL-7Rα+). (Lower Right) CMP (lin, c-kit+, Sca-1, and IL-7Rα). Error bars represent standard deviations. P values were generated by Student's t test. (B) (Left) Ratio of HSCs to CLP in lin cells from untreated wild-type and Hmgb3−/Y mice and from wild-type and Hmgb3−/Y mice 4 days after 5-FU treatment. (Right) Ratio of HSCs to CMP in lin cells from untreated wild-type and Hmgb3−/Y mice and from wild-type and Hmgb3−/Y mice 4 days after 5-FU treatment. Ratios were determined by the formula (HSC [average % lin cells)/CLP (or CMP) (average % lin cells)]. Error bars represent standard deviations. P values were generated by Student's t test.

Similar articles

Cited by

References

    1. Kondo M, Wagers AJ, Manz MG, Prohaska SS, Scherer DC, Beilhack GF, Shizuru JA, Weissman IL. Annu Rev Immunol. 2003;21:759–806. - PubMed
    1. Bustin M, Lehn DA, Landsman D. Biochim Biophys Acta. 1990;1049:231–243. - PubMed
    1. Vaccari T, Beltrame M, Ferrari S, Bianchi M. Genomics. 1998;49:247–252. - PubMed
    1. Ronfani L, Ferraguti M, Croci L, Ovitt CE, Scholer HR, Consalez GG, Bianchi ME. Development (Cambridge, UK) 2001;128:1265–1273. - PubMed
    1. Bianchi ME, Beltrame M, Paonessa G. Science. 1989;243:1056–1059. - PubMed

MeSH terms