. 2006 Sep 20;25(18):4381-9.
doi: 10.1038/sj.emboj.7601309.

Synaptic GABAA receptors are directly recruited from their extrasynaptic counterparts

Affiliations

Synaptic GABAA receptors are directly recruited from their extrasynaptic counterparts

Yury Bogdanov et al. EMBO J. .

Abstract

GABAA receptors mediate the majority of fast synaptic inhibition in the brain. The accumulation of these ligand-gated ion channels at synaptic sites is a prerequisite for neuronal inhibition, but the molecular mechanisms underlying this phenomenon remain obscure. To further understand these processes, we have examined the cellular origins of synaptic GABAA receptors. To do so, we have created fluorescent GABAA receptors that are capable of binding -bungarotoxin (Bgt), facilitating the visualization of receptor endocytosis, exocytosis and delivery to synaptic sites. Imaging with Bgt in hippocampal neurons revealed that GABAA receptor endocytosis occurred exclusively at extrasynaptic sites, consistent with the preferential colocalization of extrasynaptic receptors with the AP2 adaptin. Receptor insertion into the plasma membrane was also predominantly extrasynaptic, and pulse-chase analysis revealed that these newly inserted receptors were then able to access directly synaptic sites. Therefore, our results demonstrate that synaptic GABAA receptors are directly recruited from their extrasynaptic counterparts. Moreover, they illustrate a dynamic mechanism for neurons to modulate GABAA receptor number at inhibitory synapses by controlling the stability of extrasynaptic receptors.
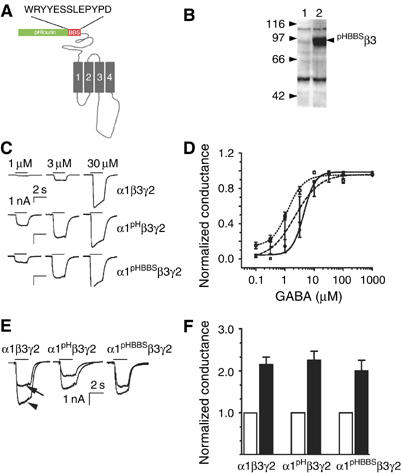

Figures

Figure 1
Figure 1
Functional expression of GABAA receptors incorporating pHBBSβ3 subunits. (A) The structure of the GABAA receptor pHBBSβ3 subunits. pHluorin and BBS were added between amino acids 4 and 5 of the mature β3 subunits and were separated by a 13-amino-acid alanine–proline linker. Tm domains 1–4 are shown in gray. (B) Analyzing expression of the pHBBSβ3 subunit by immunoblotting. Control (lane 1) or HEK-293 cells expressing GABAA receptor α1pHBBSβ3 and γ2 subunit cDNAs (lane 2) were immunoblotted with antibodies against the receptor β3 subunit. The migration of molecular mass standards is indicated. (C, D) Agonist sensitivity of GABAA receptors incorporating pHBBSβ3 subunits. HEK-293 cells were transfected with the respective murine cDNAs in a 1:1:1 ratio. At 48 h after transfection, IGABA was recorded under voltage clamp at −50 mV. Responses from individual cells are shown in panel C. Currents at individual agonist concentrations were then normalized to the maximal response observed and fitted with the Hill equation. I/Imax=1/(1+(EC50/AnH) are shown in panel D. EC50 values of 9.89±2.30, 2.38±0.4 and 6.12±1.94 were seen for GABAA receptors composed of α1β3 γ2 (□), α1pHβ3 γ2 (○) and α1pHBBSβ3γ2 (▴), respectively (mean±s.e.m.; n=6–8). (E, F) Benzodiazepine modulation of GABAA receptors incorporating pHBBSβ3 subunits. HEK-293 cells expressing GABAA receptors were voltage clamped at −50 mV. The magnitude of IGABA at EC20 agonist concentration was then measured in the absence and presence of 100 nM flurazepam as illustrated in panel E. Normalized conductances in the absence of flurazepam were given a value of 1. IGABA was potentiated by 2.15±0.18 (α1β3γ2), 2.26±0.21 (α1pHβ3γ2) and 2.09±0.25 (α1pHBBSβ3γ2) respectively (mean±s.e.m.; n=9–15) as shown in panel F.
Figure 2
Figure 2
GABAA receptors engineered to incorporate pHBBSβ3 subunits bind Bgt with high affinity. (A) GABAA receptors containing pHBBSβ3 subunits bind Bgt with high affinity. HEK-293 cells were transfected with GABAA receptors α1pHBBSβ3 and γ2 subunit cDNAs. After 48 h, cells were labelled with varying concentrations of 125I-Bgtx (1000 Ci/mmol) at 37°C for 10 min before extensive washing. The level of bound Bgt after correction for nonspecific binding was then used to estimate the affinity of Bgt for receptors containing pH/BBSβ3 subunits (•) or pHβ3 (□) (calculated using Origin software; data represent mean±s.e.m.; n=4). (B–D) Bgt slowly dissociates from GABAA receptors containing pHBBSβ3 subunits. Transfected HEK-293 cells were labelled with 5 μg/ml Rd-Bgt for 5 min and washed extensively. Labelled cells were transferred to the stage of a confocal microscope maintained at 15°C and imaged over 180 min. Images of an individual cell at 5 and 180 min are shown in panels B and C, respectively (red=Rd-Bgt, green=pHluorin). (D) The intensity of Rd-Bgt in 2–5 μm2 areas of interest was then compared to the initial levels seen at zero time, which was given a value of 100% (each data point represents mean±s.e.m.; n=4–6).
Figure 3
Figure 3
Imaging GABAA receptors incorporating pHBBSβ3 subunits in hippocampal neurons. (A–D) Visualizing GABAA receptors incorporating pHBBSβ3 subunits in neurons. 14-Div hippocampal neurons expressing GABAA receptor pH/BBSβ3 subunits were labelled with 5 μg/ml Rd-Bgt in the absence (A) or presence (B) of 50 μg/ml of unlabelled Bgt. Cells were then fixed and images recorded by confocal microscopy (red=Rd-Bgt, green=pHluorin, yellow arrows=transfected neurons expressing pHBBSβ3, white=non-transfected neurons; scale bars=15 μm). Rd-Bgt staining was also performed on neurons expressing pHBBSβ3 in the absence (C) and presence of 100 μM curare (D). (E–H) Bgt slowly dissociates from neurons expressing pHBBSβ3 subunits. Transfected neurons were labelled with 5 μg/ml Rd-Bgt for 5 min, washed, transferred to the stage of a confocal microscope maintained at 15°C and imaged for 180 min (red=Rd-Bgt, green=pHluorin). Images of an individual transfected neuron stained with Rd-Bgt at 0 and 180 min are shown in panels E and F. The lower panels represent enlargements of the boxed areas in the upper panels. (G) The intensity of Rd-Bgt staining was measured in 1–2 μm2 areas of interest over the entire recording period with levels at zero time being given a value of 100% (data represent mean±s.e.m.; n=6). (H) GABAA receptors incorporating pHBBSβ3 subunits are targeted to synaptic sites. 14-Div hippocampal neurons expressing pHBBSβ3 subunits were stained with 5 μg/ml Rd-Bgt for 5 min, washed, fixed, permeabilized, stained with anti-synapsin antibodies and imaged using confocal microscopy (red=Rd-Bgt, green=pHluorin, blue=synapsin). The lower panel represents an enlargement of the boxed area in the upper panel; the white arrowheads indicate synaptic GABAA receptors, whereas the yellow arrowheads indicate extrasynaptic populations (scale bar=10 μm).
Figure 4
Figure 4
Extrasynaptic GABAA receptors have short residence times at the cell surface. 12–14-Div hippocampal neurons expressing GABAA receptors incorporating receptor pH/BBSβ3 subunits were labelled with 5 μg/ml of Rd-Bgt without (1–4) or with (5–8) 1 h preincubation with myristoylated p4 peptide. Neurons were then incubated at 37°C for between 0 and 90 min. At varying time intervals, samples were removed, permeabilized, stained with antibodies against synapsin and then visualized by confocal microscopy (red=Rd-Bgt, green=pHluorin, blue=synapsin). Images at zero time for an individual neuron are shown in 1, 2, 5 and 6, whereas those in 3, 4, 7 and 8 represent neurons incubated for 90 min at 37°C. The right-hand panels represent enlargements of the boxed areas in the left-hand panels. The yellow and white boxed areas indicate synaptic and extrasynaptic receptor populations respectively (scale bars=5 μm).
Figure 5
Figure 5
Extrasynaptic GABAA receptors preferentially undergo clathrin-dependent endocytosis. (A, B) Cell-surface stability of extrasynaptic GABAA receptors is enhanced by inhibitors of clathrin-dependent endocytosis. The ratio of Rd-ES-Bgt:S-Bgt staining was measured in adjacent synaptic and extrasynaptic domains of RD-Bgt-stained neurons expressing pHBBSβ3 subunits over 90 min as shown in Figure 4 under control conditions (▪) or after 1 h pretreatment with M-p4 (▪) or M-Sc (▪). Data at varying time points were compared to ratios seen at zero time (which was given a value of 1). Each data point represents mean±s.e.m. from 44 to 90 synapses (n=6–8). Ratios at 90 min were also compared to the respective levels seen at zero time as shown in panel B (P4=1 h pretreatment with membrane-impermeable peptide; *significantly different from control; P<0.01; Student's t-test, n=6–8). (C–F) Internalization of Bgt-labelled GABAA receptors incorporating BBSβ3 subunits. 14-Div neurons expressing BBSβ3 subunits were labelled with 5 μg/ml Rd-Bgt for 5 min at 37°C, washed and incubated at 37°C for 120 min. After incubation, neurons were labelled with 5 μg/ml Alex-Bgt for 5 min at 37°C, washed, fixed and imaged by confocal microscopy; C=Rd-Bgt, D=Alx-Bgt, E=BBSβ3 fluorescence, F=merge. The white arrows represent internalized Rd-Bgt/GABAA receptors and yellow arrows represent clustered Rd-Bgt staining on the plasma membrane; scale bar=10 μm. (G, H) Extrasynaptic GABAA receptors show preferential colocalization with the AP2 adaptin. 14-Div hippocampal neurons expressing pHBBSβ3 were fixed, permeabilized, stained with antibodies against AP2 (red) and synapsin (blue) and visualized by confocal microscopy (green represents endogenous pHBBSβ3 fluorescence; scale bar=5 μm) The images in panel H are enlargements of the boxed area in panel G. Panel G shows a merged image and the individual channels with green representing pHluorin. The arrows represent extrasynaptic receptors that colocalize with AP2, whereas the arrowheads indicate synaptic GABAA receptors that colocalize with synapsin.
Figure 6
Figure 6
Imaging the insertion of new GABAA receptors on the surface of hippocampal neurons. 14-Div hippocampal neurons expressing GABAA receptors incorporating pH/BBSβ3 subunits were pretreated with M-p4 peptide for 1 h. Neurons were then exposed to 5 μg/ml unlabelled Bgt to label existing cell-surface receptors. After washing, neurons were incubated for 30 min at 37°C in the presence of M-p4. Neurons were then labelled with 10 nM Bgt at various time points, fixed, permeabilized and stained with antibodies against synapsin and imaged using confocal microscopy. (A–D) Neurons incubated for 5 min. (E–H) Neurons incubated for 30 min. (I–L) A neuron incubated with Rd-Bgt, M-p4 and 100 nM unlabelled toxin. In all images, red=Rd-Bgt, blue=synapsin and green=pHluorin. Images C and D, G and H, K and L represent enlargements of the boxed areas in panels A, E and I, respectively. Panels B, F and J show the Rd-Bgt channel only, whereas panels D, H and L show both Rd-Bgt and synapsin staining. The arrowheads indicate synaptic receptor populations, whereas the arrows indicate extrasynaptic receptors. (M) The ratios of newly inserted GABAA receptors were measured for extrasynaptic and synaptic domains of neurons, as outlined in Figure 5. Each data point represents mean±s.e.m. from 60 to 80 synapses; *significantly different from control; P<0.01; Student's t-test; n=7–8.
Figure 7
Figure 7
Analyzing the movement of newly inserted extrasynaptic receptors to synaptic sites. 14-Div hippocampal neurons expressing GABAA receptors were treated with 100 nM unlabelled Bgt for 10 min, washed and then subjected to a second labelling period of 5 min at 37°C with 10 nM Rd-Bgt. They were then incubated at 37°C for varying time periods before fixing followed by immunohistochemistry with anti-VIAAT antibodies. (A) shows a neuron fixed immediately after incubation with Rd-Bgt, whereas (D) shows a neuron incubated for 30 min after labelling with Rd-Bgt. In all images, red=Rd-Bgt, blue=VIAAT and green=pHluorin. Images in (B/C) and (E/F) represent enlargements of the panels in A and D, respectively. Panels C and D show only Rd-Bgt and VIAAT staining. The arrowheads indicate synaptic receptor populations, whereas the arrows indicate extrasynaptic receptors. (G) The ratio of synaptic Bgt to extrasynaptic staining was calculated from neurons expressing pH/BBSβ3 subunits over time, with the ratio evident at zero time (directly after labelling with Rd-Bgt) being given a value of 1.0. Each data point represents mean±s.e.m. from 44 to 90 synapses; *significantly different from control; P<0.001, n=4.

References

    1. Alldred MJ, Mulder-Rosi J, Lingenfelter SE, Chen G, Luscher B (2005) Distinct gamma2 subunit domains mediate clustering and synaptic function of postsynaptic GABAA receptors and gephyrin. J Neurosci 25: 594–603 - PMC - PubMed
    1. Bedford FK, Kittler JT, Muller E, Thomas P, Uren JM, Merlo D, Wisden W, Triller A, Smart TG, Moss SJ (2001) GABA(A) receptor cell surface number and subunit stability are regulated by the ubiquitin-like protein Plic-1. Nat Neurosci 4: 908–916 - PubMed
    1. Borgdorff AJ, Choquet D (2002) Regulation of AMPA receptor lateral movements. Nature 417: 649–653 - PubMed
    1. Chen ZW, Chang CS, Leil TA, Olcese R, Olsen RW (2005) GABAA receptor-associated protein regulates GABAA receptor cell-surface number in Xenopus laevis oocytes. Mol Pharmacol 68: 152–159 - PubMed
    1. Choquet D, Triller A (2003) The role of receptor diffusion in the organization of the postsynaptic membrane. Nat Rev Neurosci 4: 251–265 - PubMed

Publication types

MeSH terms