. 2006 Sep 29;362(4):861-75.
doi: 10.1016/j.jmb.2006.07.072. Epub 2006 Aug 1.

Co-evolutionary analysis of domains in interacting proteins reveals insights into domain-domain interactions mediating protein-protein interactions

Affiliations

Co-evolutionary analysis of domains in interacting proteins reveals insights into domain-domain interactions mediating protein-protein interactions

Raja Jothi et al. J Mol Biol. .

Abstract

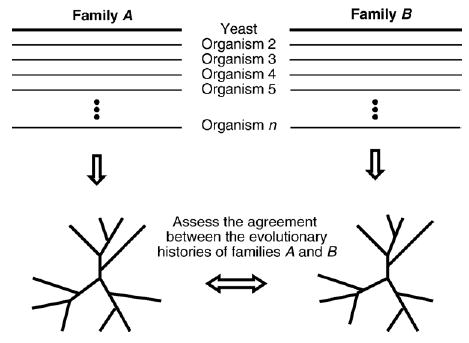
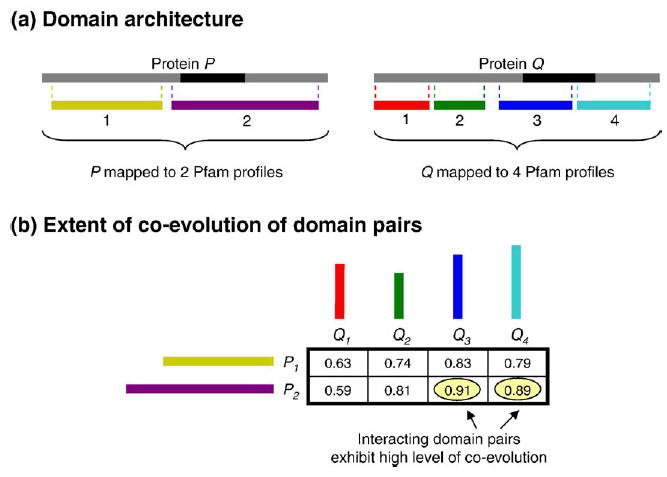
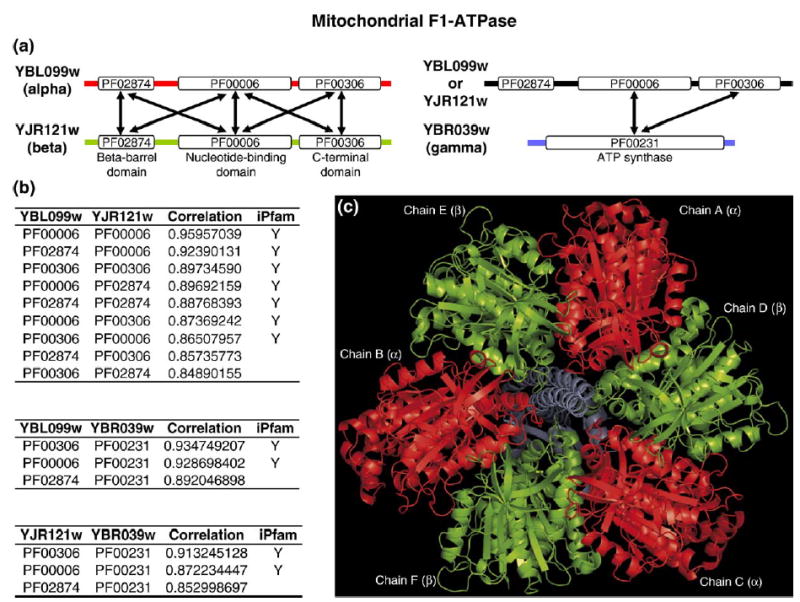
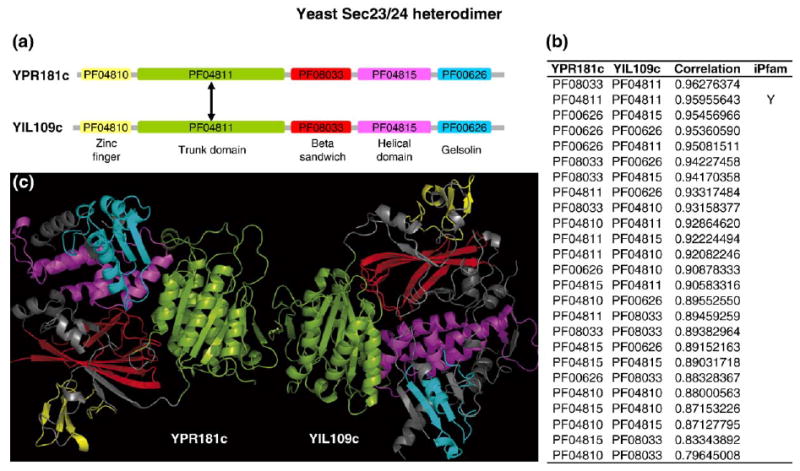
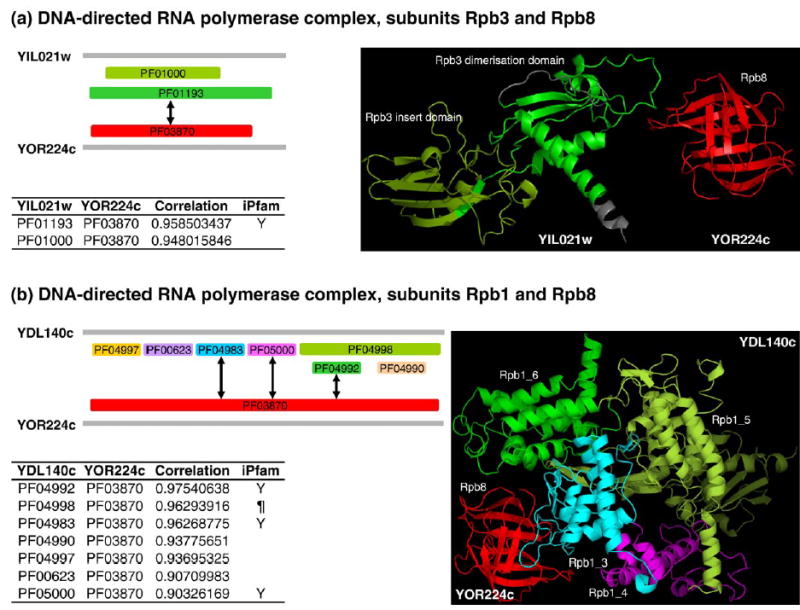
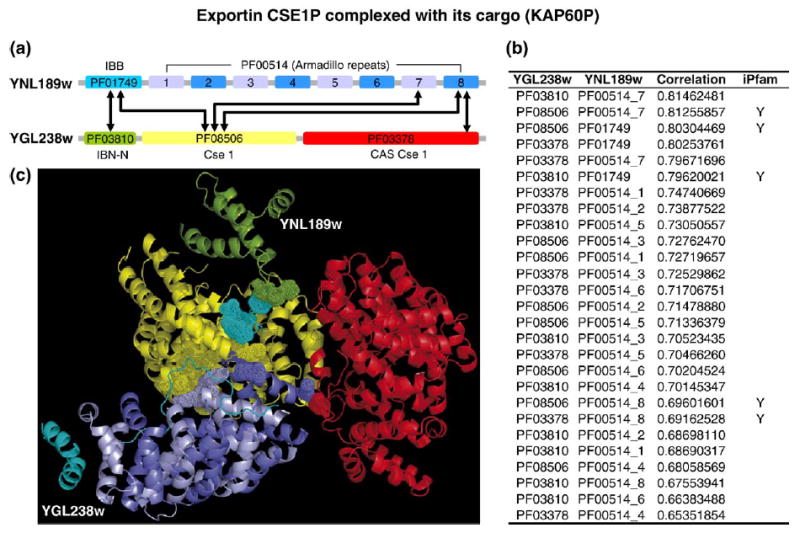
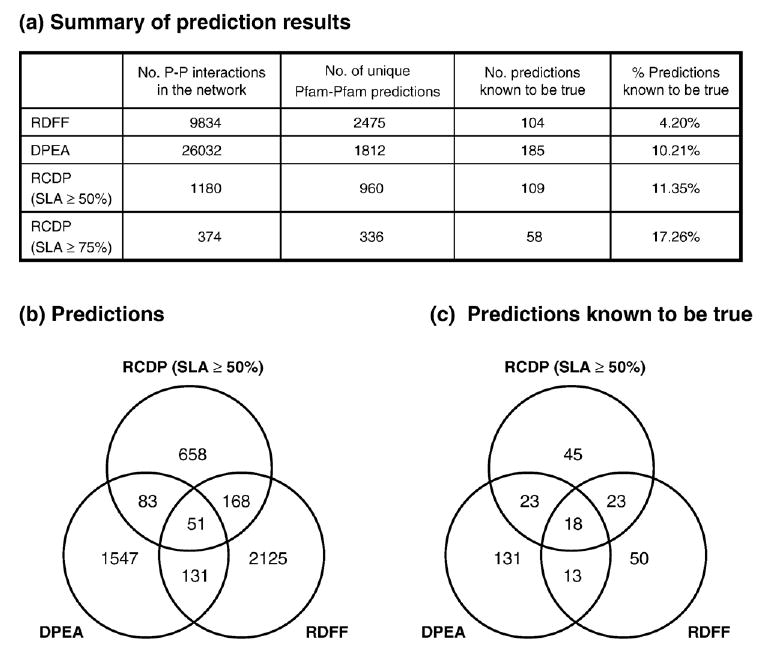
Recent advances in functional genomics have helped generate large-scale high-throughput protein interaction data. Such networks, though extremely valuable towards molecular level understanding of cells, do not provide any direct information about the regions (domains) in the proteins that mediate the interaction. Here, we performed co-evolutionary analysis of domains in interacting proteins in order to understand the degree of co-evolution of interacting and non-interacting domains. Using a combination of sequence and structural analysis, we analyzed protein-protein interactions in F1-ATPase, Sec23p/Sec24p, DNA-directed RNA polymerase and nuclear pore complexes, and found that interacting domain pair(s) for a given interaction exhibits higher level of co-evolution than the non-interacting domain pairs. Motivated by this finding, we developed a computational method to test the generality of the observed trend, and to predict large-scale domain-domain interactions. Given a protein-protein interaction, the proposed method predicts the domain pair(s) that is most likely to mediate the protein interaction. We applied this method on the yeast interactome to predict domain-domain interactions, and used known domain-domain interactions found in PDB crystal structures to validate our predictions. Our results show that the prediction accuracy of the proposed method is statistically significant. Comparison of our prediction results with those from two other methods reveals that only a fraction of predictions are shared by all the three methods, indicating that the proposed method can detect known interactions missed by other methods. We believe that the proposed method can be used with other methods to help identify previously unrecognized domain-domain interactions on a genome scale, and could potentially help reduce the search space for identifying interaction sites.


Figures

Figure 1
Figure 1
A schematic overview of the co-evolutionary analysis. Multiple sequence alignments of two yeast proteins for a common set of species are constructed, followed by the construction of their phylogenetic trees and similarity matrices. The extent of agreement between the evolutionary histories of the two yeast proteins is assessed by computing a linear correlation coefficient between the two similarity matrices.
Figure 2
Figure 2
Relative degree of co-evolution of domains in interacting proteins. (a) Domain architecture of proteins P and Q (shown using gray boxes) that are known to interact (interaction sites are shown as black boxes). (b) Correlation (agreement) scores, measuring the degree of co-evolution, for all possible domain pairs in P and Q. Domain pairs that mediate the interaction between proteins P and Q are expected to have co-evolved, and thus are expected to have a high correlation score.
Figure 3
Figure 3
Interactions among alpha (ATP1), beta (ATP2), and gamma (ATP3) chains of the ATPase. (a) Protein sequences are shown using thick colored lines: red for the alpha chain, green for the beta chain, blue for the gamma chain, and black for alpha or beta chain. Pfam domain annotations are shown using rectangular boxes (not drawn to scale). The names of the protein sequences are to the left of the domain architecture. Inter-chain domain–domain interactions, which are known to be true from PDB crystal structures (as inferred in iPfam), are shown using double-arrow lines in the domain architecture. (b) The correlation scores of all possible domain pairs between two proteins, sorted in descending order, are listed as tables. Domain pairs that are known to interact, denoted with Y, have high correlation scores exhibiting high degree of co-evolution. (c) A bottom view of the cartoon of bovine mitochondrial F1-ATPase PDB crystal structure (PDB: 1h8e), supporting the interactions, is shown with alpha, beta, and gamma chains colored in red, green, and blue, respectively.
Figure 4
Figure 4
Interaction between Sec23 (YPR181c) and Sec24 (YIL109c) components of the COPII coat of ER-golgi vesicles. (a) Protein sequences are shown using thick gray lines, and Pfam domain annotations are shown using colored rectangular boxes (not drawn to scale). The names of the protein sequences are to the left of the domain architecture. An inter-chain domain–domain interaction, which is known to be true from a PDB crystal structure (as inferred in iPfam), is shown using a double arrow line. (b) The correlation scores of all possible domain pairs between the two proteins, sorted in descending order, are listed as a table. The domain pair that is known to interact, denoted with Y, has a high correlation score, exhibiting high degree of co-evolution. (c) A cartoon of PDB crystal structure (PDB: 1m2v), supporting the interaction, is shown with domain colors consistent with the domain architecture.
Figure 5
Figure 5
Inferred domain–domain interactions in DNA-directed RNA polymerase complex. Protein sequences are shown using thick gray lines, and the domain annotations are shown using colored rectangular boxes (not drawn to scale). The names of the protein sequences are to the left of the domain architecture. The correlation scores of all possible domain pairs between the two proteins, sorted in descending order, are listed as a table. Inter-chain domain–domain interactions, which are known to be true from PDB crystal structures (as inferred in iPfam), are shown using double-arrow lines in the domain architecture, and Y in the table. Domain pairs that are known to interact have high correlation scores, exhibiting high degree of co-evolution. Cartoons of PDB crystal structures, supporting the interactions, are shown with domain colors consistent with the domain architecture. (a) Interaction between subunits 3 and 8 of the DNA-directed RNA polymerase (PDB: 1y1v). (b) Interaction between subunits 1 and 8 of the DNA-directed RNA polymerase (PDB : 1y1v). Since PF04998 contains nested domain PF04992, interaction between PF04998 and PF03870 is considered to be true (denoted by ¶).
Figure 6
Figure 6
Uncorrelated set of correlated mutations. Each rectangular box is a cartoon representation of a multiple sequence alignment of a family of orthologous proteins/domains. There are a total of six families, A, B, C, D, E, and F. The binding residues of interaction, referred to as binding surface, between family A and each of the other five families are highlighted using distinct colors. Under the co-evolutionary hypothesis, which states interacting domains undergo correlated mutations, mutations at each of A's five surface patches must be correlated with those at the binding surface in the corresponding interacting partners. However, mutations at A's five surface patches need not be correlated. As a result, for example, it may be unreasonable to expect A and E to have similar evolutionary histories even though the corresponding binding surfaces in A and E may have high correlation.
Figure 7
Figure 7
Interaction between importin alpha Srp1 (YNL189w) and nuclear export receptor Cse1 (YGL238w). (a) Protein sequences are shown using thick gray lines, and Pfam domain annotations are shown using colored rectangular boxes (not drawn to scale). The names of the protein sequences are to the left of the domain architecture. Inter-chain domain–domain interactions, which are known to be true from PDB crystal structures (as inferred in iPfam), are shown using a double arrow line. (b) The correlation scores of all possible domain pairs between two proteins, sorted in descending order, are listed as a table. Two of the five domain pairs, which are known to interact (denoted with Y), have high correlation scores, exhibiting high degree of co-evolution. The reason for the other three known interacting domain pairs not having high correlation scores could be attributed to “uncorrelated set of correlated-mutations” illustrated in Figure 4. (c) A cartoon of the PDB crystal structure (PDB: 1wa5), supporting the interaction, is shown with domain colors consistent with the domain architecture. A subset of the interaction sites is shown using dotted spheres.
Figure 8
Figure 8
(a) An indirect comparison of RCDP's prediction results with those of RDFF and DPEA methods. The predictions were validated against the known domain–domain interactions found in PDB crystal structures (as inferred in iPfam50). The prediction accuracies of the three methods are not directly comparable as the results are from datasets of varying sizes. However, the dataset used to test RCDP is a subset of that used by Chen and Liu, and Riley et al. (b) Only about 5% of RCDP's predictions are confirmed by both DPEA and RDFF methods. Overall, about 31% of RCDP's predictions are confirmed by either DPEA or RDFF, with about 14% and 23% of RCDP's predictions confirmed by DPEA and RDFF, respectively. This indicates that each of these three methods can detect known domain–domain interactions missed by the other two.
Figure 9
Figure 9
Domain–domain interaction predictions results for 109 yeast protein–protein interactions, each of which (i) is between proteins with at least 50% of their sequence lengths assigned with Pfam domain(s), (ii) is not an interaction between two one-domain proteins, (iii) contains a domain pair that is known to interact (as reported iPfam), and (iv) is between proteins having orthologs in at least a common set of ten species. The performance of RCDP versus a method that picks a domain pair at random among all possible domain pairs is plotted. The results are broken down according to the number of potential domain–domain contacts between an interacting protein pair. RCDP clearly outperforms random picks by about 9%, which is significant (p-value 1.05×10⁻²) considering the fact that it has been shown before (Figure 4 in Nye et al.31), on a different dataset, that random performs as good as three other popular methods,, for inferring domain–domain interactions.

Similar articles

Cited by

References

    1. Uetz P, Giot L, Cagney G, Mansfield TA, Judson RS, Knight JR, et al. A comprehensive analysis of protein–protein interactions in Saccharomyces cerevisiae. Nature. 2000;403:623–627. - PubMed
    1. Ito T, Chiba T, Ozawa R, Yoshida M, Hattori M, Sakaki Y. A comprehensive two-hybrid analysis to explore the yeast protein interactome. Proc Natl Acad Sci USA. 2001;98:4569–4574. - PMC - PubMed
    1. Gavin AC, Bosche M, Krause R, Grandi P, Marzioch M, Bauer A, et al. Functional organization of the yeast proteome by systematic analysis of protein complexes. Nature. 2002;415:141–147. - PubMed
    1. Ho Y, Gruhler A, Heilbut A, Bader GD, Moore L, Adams SL, et al. Systematic identification of protein complexes in Saccharomyces cerevisiae by mass spectrometry. Nature. 2002;415:180–183. - PubMed
    1. Giot L, Bader JS, Brouwer C, Chaudhuri A, Kuang B, Li Y, et al. A protein interaction map of Drosophila melanogaster. Science. 2003;302:1727–1736. - PubMed

Publication types

MeSH terms