. 2006 Oct;5(10):1674-87.
doi: 10.1128/EC.00252-06. Epub 2006 Sep 1.

TOS9 regulates white-opaque switching in Candida albicans

Affiliations

TOS9 regulates white-opaque switching in Candida albicans

Thyagarajan Srikantha et al. Eukaryot Cell. 2006 Oct.

Abstract

In Candida albicans, the a1-alpha2 complex represses white-opaque switching, as well as mating. Based upon the assumption that the a1-alpha2 corepressor complex binds to the gene that regulates white-opaque switching, a chromatinimmunoprecipitation-microarray analysis strategy was used to identify 52 genes that bound to the complex. One of these genes, TOS9, exhibited an expression pattern consistent with a "master switch gene." TOS9 was only expressed in opaque cells, and its gene product, Tos9p, localized to the nucleus. Deletion of the gene blocked cells in the white phase, misexpression in the white phase caused stable mass conversion of cells to the opaque state, and misexpression blocked temperature-induced mass conversion from the opaque state to the white state. A model was developed for the regulation of spontaneous switching between the opaque state and the white state that includes stochastic changes of Tos9p levels above and below a threshold that induce changes in the chromatin state of an as-yet-unidentified switching locus. TOS9 has also been referred to as EAP2 and WOR1.


Figures
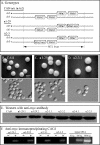
FIG. 1.
FIG. 1.
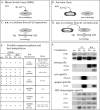
The strains used for ChIP-chip analysis normally suppressed switching. (A) The genotype of the strains used to identify targets of the a1-α2 repressor complex. (B, C, and D) Cells from the parent CAI4 strain and the Myc-tagged a1 (a1-29) and α2 (α2-3) strains formed normal white colonies and cells with the round, white phenotype, indicating that tagged a1 and α2 fully retained repressor function. (E) Western blot treated with anti-Myc antibody. (F) ChIP with anti-Myc antibody and subsequent PCR of CAG1, a known target of the a1-α2 complex reveal specific Myc-tagged a1 and α2 binding. In panel F, a minus indicates the absence of anti-Myc antibody and a plus indicates the presence of anti-Myc antibody in the immunoprecipitation procedure. DIC, differential interference contrast.
FIG. 2.
FIG. 2.
MTLa1 and MTLα2 bind to discrete genomic loci throughout the genome of C. albicans. Six examples of genomic regions enriched by the ChIP-chip procedure with a1 (red) or α2 (green). The log2 ratios of tagged versus untagged signals are presented for each factor below the locations of the predicted ORFs for the genomic region (dark blue) with the ORFs predicted to be regulated by the binding event indicated with their systematic names. The scale above each region represents 10 kb in 1-kb increments.
FIG. 3.
FIG. 3.
Transcription profiles were used to identify candidate MSGs and candidate activators of MSGs. (A) Model of a1-α2 repression of MSG expression in a/α cells. (B) Model of a1-α2 repression of an MSG activator. (C) MSG activation of switching in a/a or α/α cells. (D) Role of an MSG activator in switching. (E) Possible expression patterns, best interpretations of expression patterns, and genes that fit the patterns in the different categories. (F) Examples of gene expression patterns revealed by Northern analysis in the different categories. Wh, white; Op, opaque.
FIG. 4.
FIG. 4.
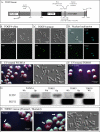
Deletion of TOS9 results in cells that cannot switch and are blocked in the white phase. (A) Description of TOS9 and its 5′ upstream region. The transcription start and stop sites and poly(A) tail were identified by RACE analysis. The directions of transcription of TOS9 and the divergently transcribed gene 19.4883 are denoted by straight arrows. (B) Differential interference contrast and fluorescence images of white cells of strain TOGF4 which express TOS9 tagged at its carboxy terminus with GFP. (C) Differential interference contrast and fluorescence images of opaque cells of stain TOGF4. (D) Costaining of DAPI and GFP in TOGF4 demonstrates that Tos9p is localized to the nuclei of opaque cells. (E, F) UV treatment of parent strain WUM5A and the TOS9 null mutant TOHO3 stimulated switching only in the former. (G) TOS9 is transcribed selectively in opaque cells of WUM5A and heterozygous mutants TOHE2 and TOHE3. It is not expressed in TOHO3 cells, which are blocked in white. Wh, white; Op, opaque. (H) The TOS9 null mutant rescued by transformation with the TOS9 ORF under the regulation of the MET3 promoter formed opaque sectors in the absence of methionine and cysteine. DIC, differential interference contrast.
FIG. 5.
FIG. 5.
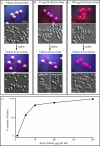
Misexpression of TOS9 in white cells causes mass conversion to the opaque phase. TOS9 was placed under the control of a tetracycline (doxycycline)-inducible promoter at an ectopic site in TOS9/TOS9 parent strain WUM5A to generate strain Wr1. (A, B, C) White, pink, and red colonies of Wr1 cells treated with 0, 50, and 200 μg/ml doxycycline, respectively, contained white, white plus opaque, and opaque cells, respectively. Replating in the absence of doxycycline demonstrated white, a mixture of white and opaque, and opaque colonies, respectively. (D) Dose-response curve of doxycycline induction of the switch from white to opaque in strain Wr1. Data from two experiments, each including 200 colonies per doxycycline concentration, were pooled. The data from the two were highly similar.
FIG. 6.
FIG. 6.
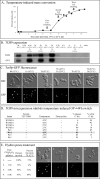
When opaque cells were induced to mass convert to white by a shift from 25°C to 42°C, the TOS9 transcript and protein levels decreased during the period preceding phenotypic commitment (the switch) to the white phenotype. The switch event was inhibited by addition of hydroxyurea just prior to the commitment event. It was also inhibited by misexpression of TOS9 after the temperature shift. (A) The kinetics of phenotypic commitment to the white phase after an opaque cell population is shifted from 25°C to 42°C. The majority of cells commit to the white phase in concert with the second cell doubling. (B) The TOS9 transcript level decreases to a negligible level after 0.5 h at 42°C, rebounds at 2 h, and then decreases to a very low level by 5.5 h. Reexpression to the original level before the temperature shift can be induced by reducing the temperature from 42°C to 25°C up to the point of phenotypic commitment to the white phase (1 h, 3 h) but not after phenotypic commitment (7 h). (C) Tos9p fluorescence decreases during the period preceding phenotypic commitment in strain Wr1. A reduction in temperature at 3 h, but not at 7 h, reestablishes Tos9p fluorescence in the nucleus. (D) Misexpression of TOS9 at 42°C, by doxycycline induction of strain Wr1, blocks the temperature-induced switch to white (data in bold print). (E) Addition of hydroxyurea at 3 h, but not at 6 h, blocks commitment (the switch) to the white phase. Wh, white; Op, opaque.
FIG. 7.
FIG. 7.
A model for spontaneous switching between the white and opaque phases. The salient features of the model are the following. Spontaneous self-induction of TOS9 expression in white leads to a change in chromatin state of an as-yet-unidentified switching locus, gene X. This change requires DNA replication. Continued expression of TOS9 maintains the opaque chromatin state and hence the opaque phenotype. A spontaneous decrease in TOS9 expression below a threshold results in a change in gene X from an opaque to a white chromatin state and, hence, a change to the white phenotype. The change in chromatin state of gene X activates its expression, but it is not clear if activation is in the white or the opaque state. Gene X must then regulate the pattern of phase-specific gene expression and phenotype. TOS9 has not been excluded as the site of change. The correlation of commitment and the second cell doubling in the opaque-to-white transition suggests that opaqueness is the recessive state and whiteness is the dominant state, as previously proposed (41).

References

    1. Anderson, J. M., and D. R. Soll. 1987. Unique phenotype of opaque cells in the white-opaque transition of Candida albicans. J. Bacteriol. 169:5579-5588. - PMC - PubMed
    1. Bedell, G., and D. R. Soll. 1979. The effects of low concentrations of zinc on the growth and dimorphism of Candida albicans: evidence for zinc-resistant and zinc-sensitive pathways for mycelium formation. Infect. Immun. 26:348-354. - PMC - PubMed
    1. Bennett, R. J., and A. D. Johnson. 2005. Mating in Candida albicans and the search for a sexual cycle. Annu. Rev. Microbiol. 59:233-255. - PubMed
    1. Bergen, M., E. Voss, and D. R. Soll. 1990. Switching at the cellular level in the white-opaque transition of Candida albicans. J. Gen. Microbiol. 136:1925-1936. - PubMed
    1. Borneman, A. R., J. A. Leigh-Bell, H. Yu, P. Bertone, M. Gerstein, and M. Snyder. 2006. Target hub proteins serve as master regulators of development in yeast. Genes Dev. 20:435-448. - PMC - PubMed

Publication types

MeSH terms